Create Edit
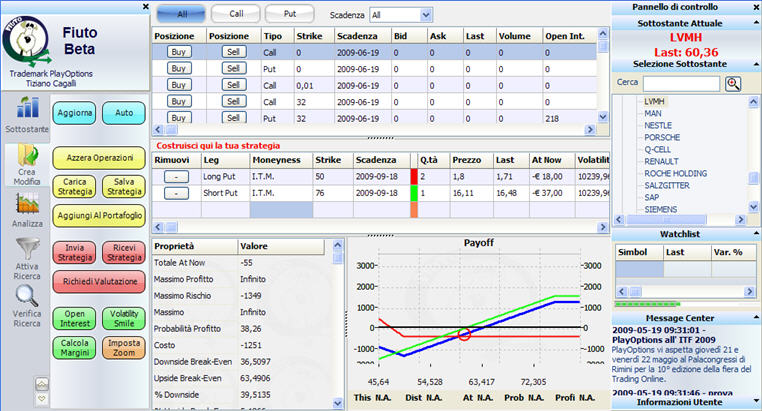
This is the heart of Fiuto because in this window we can find all the options connected to the underlying selected in the control panel. In this window therefore we will build our strategies in options.

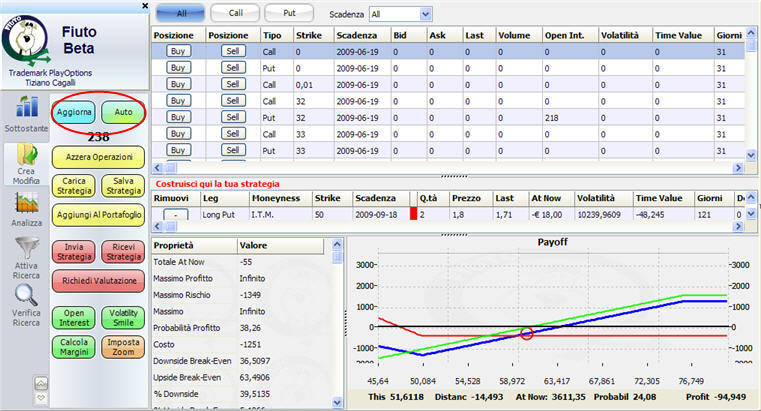
As we have seen talking about the underlying, the first operation is the data updating. Therefore we will click on the key “Update” to have the last available data updating.
Activating then the key “automatic” we will guarantee a constant flow of updating with the lilt pointed out by the countdown.

Before examining the other keys on the left side, let’s analyze the central section of the panel.
In the upper section we can establish if our interest is only for the Calls or only for the Puts or for both and for what expirations we want to be provided with the chain of the options.

The columns of the options chain show us all data connected to the single option, from the strike, to the expiration, to the last noticed book values, up to the Greeks values.
The construction of the strategy in options is made through the keys Buy & Sell positioned on the left of each option. With a click on these keys we can move to the section “Build here your strategy” the single strategy legs that we want to analyze.

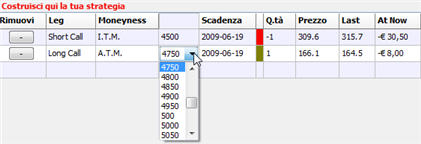
In this last section we can directly and simply amend all the variable fields positioning the mouse on the field, clicking and going then to work on the menu that is prompted. We can then buy what we had previously supposed to sell, change strike, expiration, etc. etc.

From the column “Leg” we can also plan the use of the underlying, with Long Stock and Short Stock, while with the key “delete” we can eliminate the specific operation.
NB: in case of purchase, by default, the option is loaded with the ASK price, while in case of sale, with the BID price. In case of underlying, the price will be the LAST.

The fields “Price” and “Last” as well are modifiable with a click.

With a double click on the option color and we can change the leg color on the PayOff graphic.

Between the columns “expiration” and “q.ty” we can notice a coloured bar. The position will be drown on the payoff graph with this same colour.
We can also resize the sections in which the window is divided to give larger space and evidence to what we are interested in.
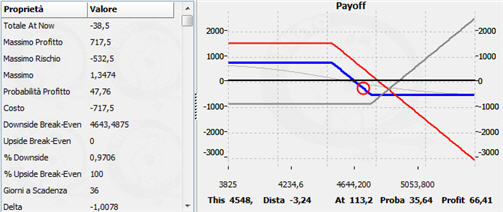
In the lower section of the screen we can find the summarized data of the strategy that we have built and the payoff graph that represents it.

With the mouse positioned on the payoff, a right click will allow us to save a graph bmp image.
Let’s now examine the functions connected to the other keys on the left side of the screen.


Discussione