Underlying
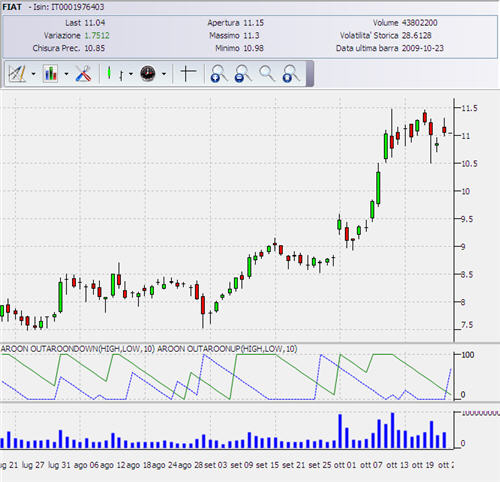
The central part is reserved to price graph and the volume histogram of the selected underlying.
The upper part shows the informations gathered from the last update and just below there are other buttons that allow us to access funtions and specific informatons: from a large number of indicators and oscillators, to the study graphs applicable, to the modification of the display of data.

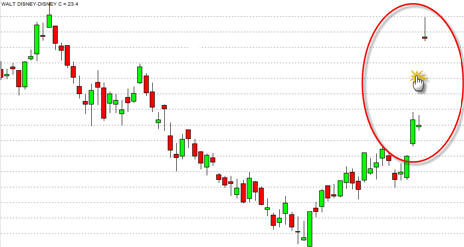
As soon as you select the underlying in which you want to see the graphic, you will have to wait for few seconds and you will see the bar of the last quotes day. If some bars are missing in the graphic, it means that you haven't update the stroic chart for some days and so are dispayed only the bars of the last update and the current bar. To complete the graph, simply press the button “Update ” and wait few seconds to download the required data.

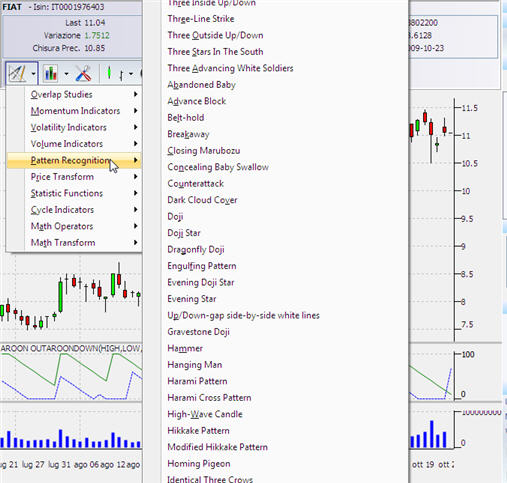
Remember that you can identify all the patterns of Japanese candles in the specific section:


Discussione