Sight Volatility
Volatility is the principal actress in the determination of the option price.

Knowing and being able to appraise it are the key to be able to effect trading in options. Let’s do together a fast revision of some of its theoretical concepts.
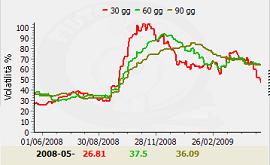
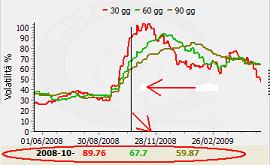
Mathematically volatility is the appraise in percentage of how much the underlying’s price could change in one year of 252 days. For instance if the volatility measured today returns a value of 50% while the underlying’s price is 10 Euro, it can be stated that the forecasting is that, in 252 days, the underlying’s price can float in a range that varies from 15 to 5 Euro. That is 50% more or less than the actual price. I can be stated that high volatility means larger probability that the option buyer be successful. And it can be stated as well that with high volatility the cost of the options will be more expensive. The graph, positioned in the central lower part of the screen, shows three different volatility calculations. This helps us to understand if the actual be the best moment to go to market with the strategy that we have elaborated.
Dragging the mouse on the curves of the graph, we can read the values that are prompted on the lower part. The calculations are reported for the volatilities calculated at 30, 60 and 90 days.

Note. It is interesting to notice that a volatility at 30 days greater than the volatilities at 60 or 90, is index of a rapid underlying’s prices descent.


Discussione