Indicators
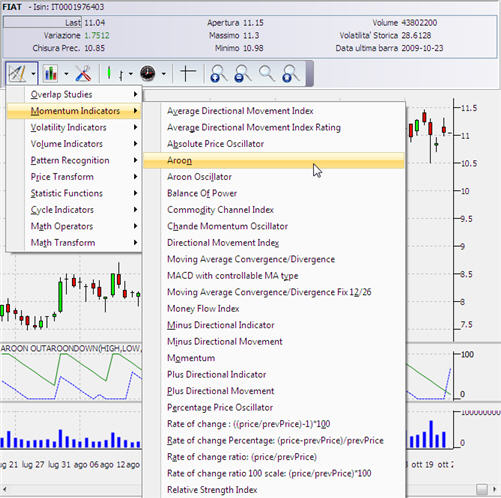
Through this key we can enter to a complete station of technical analysis, complete of a large number of indicators and oscillators organized for logical position:
* OverlapSudies
* Momentum Indicators
* Volume Indicators
* Pattern Recognition: are coded all figures of Japanese candlestick
* Price Trasform: price model
* Statistic Functions
* Cycle Indicators
* Math Operators
* Math Transform
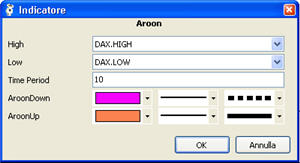
We select the indicator that we intend to appraise and the following window proposes its default configuration. In this way we can accept or modify the parameters of the indicator.


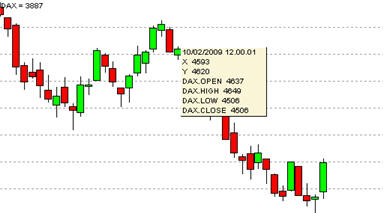
To notice that clicking with the left key with the mouse on the graph, and maintaining it pressed, we can read the data of every single candle and of any possible indicators plotted on the graph.

We can apply the same procedure to read the values of indicators and oscillators disposed separately the graph, simply positioning the mouse on the section devoted to the indicator, pressing the left key and dragging the mouse to intercept the desired date.

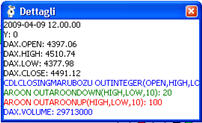
Pressing the button <Data View> all the indicators and candle values will be display on a pop-up window.


Discussione