

How to use the Manual
Quick Guide
Video Tutorial
Iceberg Features
In-depth analysis
Brokers
Data Feed
Other Manuals of beeTrader Trading Platform
How to use the Manual
Quick Guide
Video Tutorial
Iceberg Features
In-depth analysis
Brokers
Data Feed
Other Manuals of beeTrader Trading Platform
 Aggiungi questa pagina al tuo libro
  Rimuovi questa pagina dal tuo libro
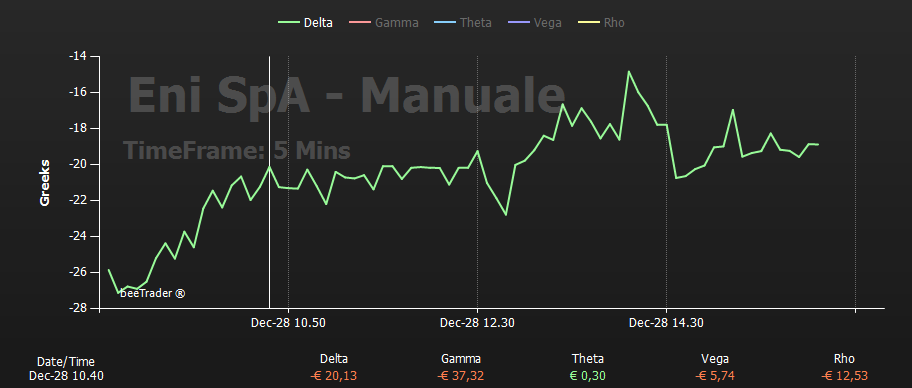
Besides the Payoff graph, in the section Charts we have the histograms of profit/loss for every greek. The graph “Greeks (Evolving)” monitors in real time its course, while the graph “Greeks (History)” show the greeks history profit & loss, since the strategy was created. Lastly the graph “Greeks (Realized)” shows the realized profit & loss for every greek.
| Payoff | Greeks (Evolving) |
|---|---|
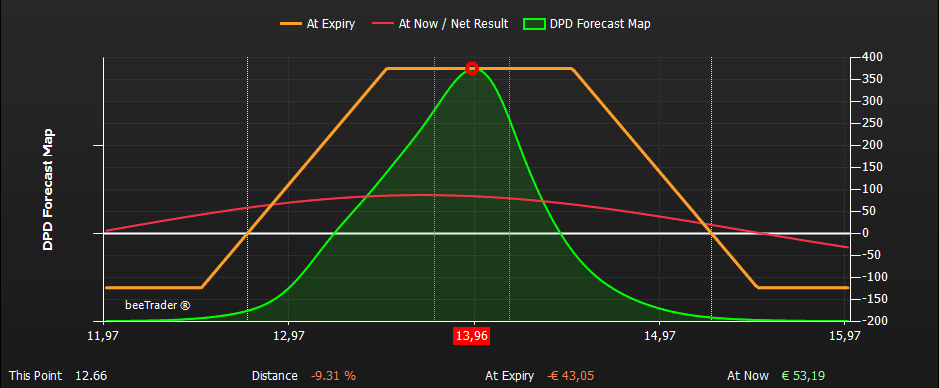 |  |
| Greeks (History) | Greeks (Realized) |
|---|---|
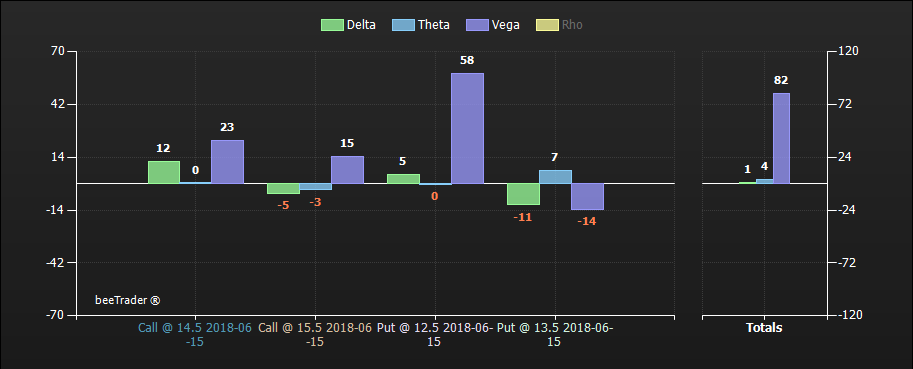 |  |
| In order to have true values it is necessary that the date and the price (present in the section Trades) match the real ones |

 Mostra, modifica libro (
 Aiuto
Aiuto