

How to use the Manual
Quick Guide
Video Tutorial
Iceberg Features
In-depth analysis
Brokers
Data Feed
Other Manuals of beeTrader Trading Platform
How to use the Manual
Quick Guide
Video Tutorial
Iceberg Features
In-depth analysis
Brokers
Data Feed
Other Manuals of beeTrader Trading Platform
 Aggiungi questa pagina al tuo libro
  Rimuovi questa pagina dal tuo libro
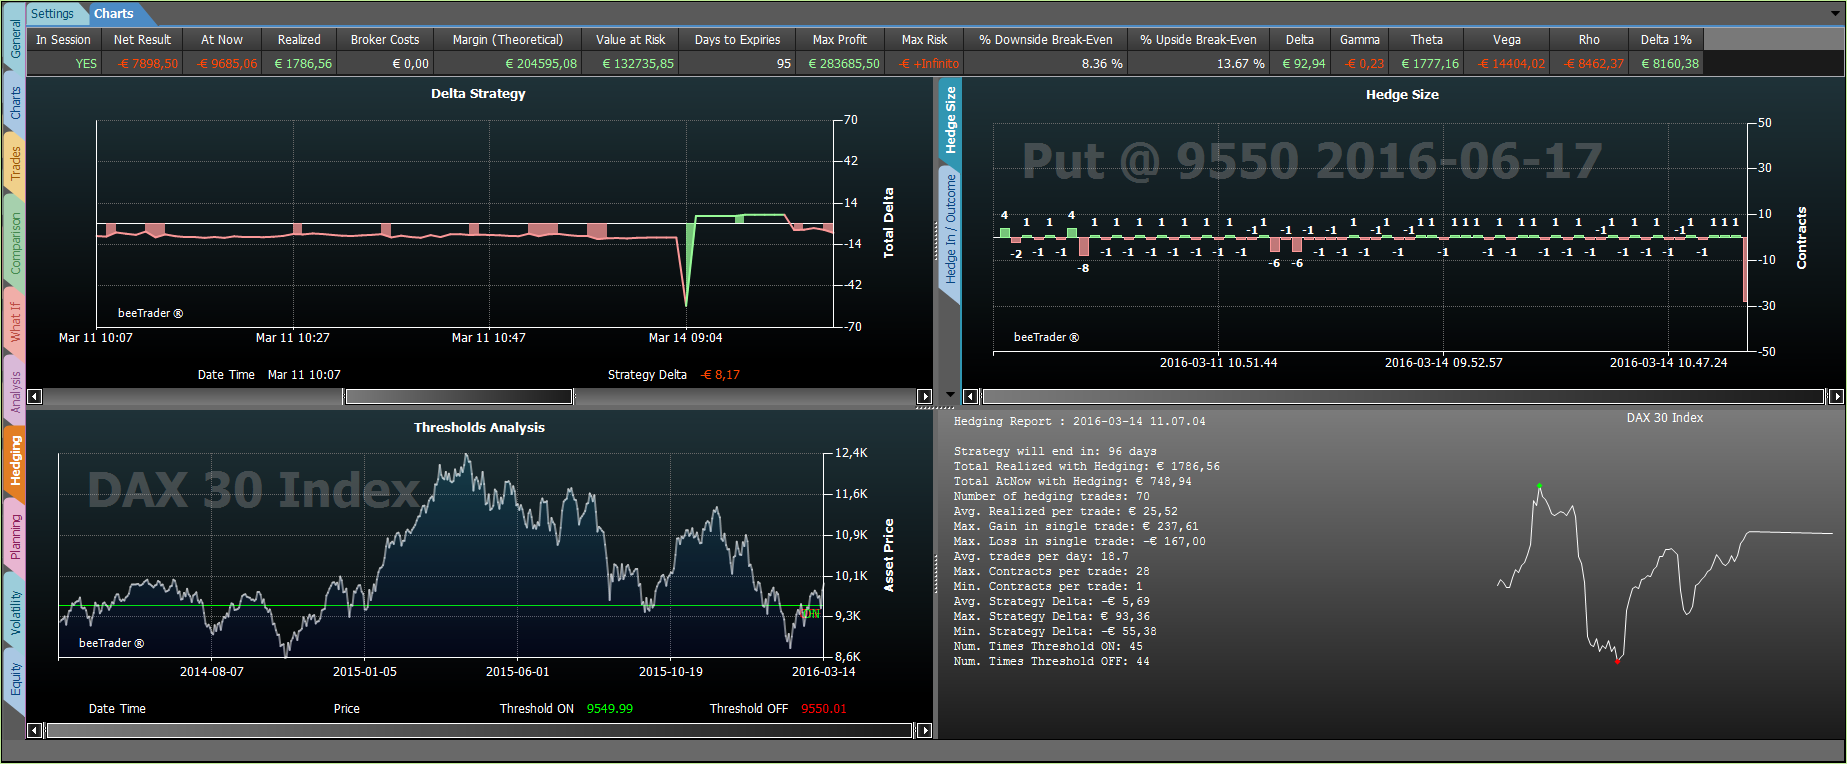
 Hedging section has two tab: Settings e Charts which will be analyzed.
 | 24/03/2016 | Hedging - Cos'è l'hedging - Didattico | 11:42 |  |
| 24/03/2016 | Hedging - Impostazioni | 18:44 | |
| 24/03/2016 | Hedging - Analisi | 12:52 | |
Click here to watch other video Video di Iceberg
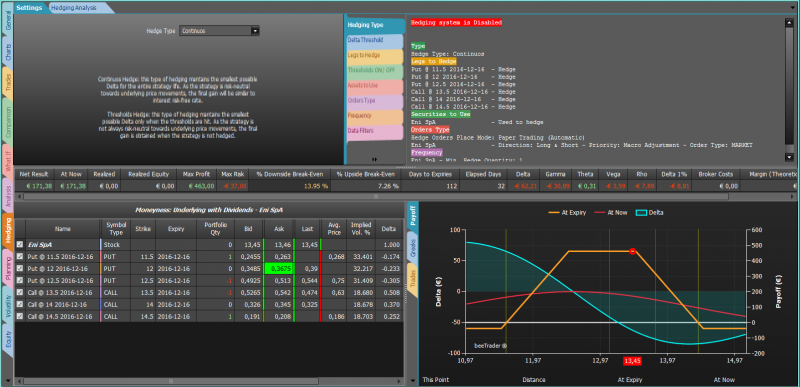
In “Settings” is present the Wizard which allows the user to choose a hedging typology. On the right, the panel summarizes the settings .
The low section summarizes the strategy with leg, the payoff, the greeks course and the trades.
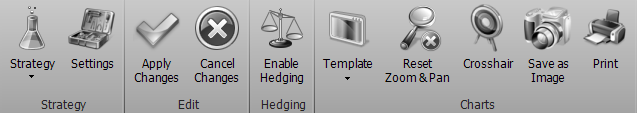
 | open the sub-menu Strategy | |
 | it allows to create a new strategy | |
 | it allows to open a previous saved strategy | |
 | it allows to save the strategy in use | |
 | open the window Strategy Settings for strategy settings | |
 | it confirm changes in Hedging settings |
 | it delete changes in Hedging settings |
 | enable or disable Hedging | |
 | open the sub-menu “Template” | |
 | it allows to save the template of the payoff in use. Il template is the configuration of the Payoff | |
 | it allows to load template previously saved and apply them to the payoff in use | |
 | it allows to save template in use as default for the next payoff | |
 | it allows to reset the zoom | |
 | it allows to enable or disable the Crosshair for the payoff | |
 | it allows to save the payoff of the strategy in image format (*.png). The image will be saved to the Pictures folder of beeTrader, in the user's Documents | |
 | it allows to print the Payoff of Strategy currently in use. Feature available on the PC in use if there is a printer | |

In “Hedging Type” the user can choose the hedging typology: Continuos or Threshold.

Delta 0 with tolerance-: allows you to set a threshold for the value of the delta to be protected, so not delta to 0, but for example +/- 2 €. The system will keep the strategy delta within the set threshold. As soon as the delta exceeds the threshold (positive or negative), the delta will be brought to 0 and the set thresholds will revert to +/- 2 € in the example.

In the section “Legs to Hedge” you can choose the legs that you want to include in the calculation of the delta to protect.

In the section “Hedging Type” is selected Threshold mode, in Thresholds ON / OFF you can set the thresholds, for every legs, in which the hedging will be enabled(ON Level) or disbled (OFF Level).

In this section you can add the instrument (stocks, futures, options, ETF, etc.) to be used to neutralize delta.
| Nota: If you use an ETF as an hedging instrument you need to set the “ETF ratio” of that ETF. You set this parameter in Symbol Manager. It denote the ratio between the underlying and the ETF. Take an example: The underlying is the dj Euro Stoxx 50 and it quote 2800 points, the ETF quote 28, the ETF ratio that you have to set is 100. This rule is valid for long ETF, whether the ETF is short you have to set a negative value. |


This section allows to set the control frequency of the strategy's delta, or the system will calculate delta.
Mode:
The “Contracts” mode is equivalent to using the “Delta 0 with tolerance” that can be set on the Delta Thresholds tab. Each contract has its own delta value therefore, in the example, setting a minimum quantity of 2 shares (with a delta 1 €) is equivalent to having set 2 € in the Delta Threshold value.
For all other modes (Time Interval, Timo of Day, Price Change) the Delta Threshold acts as primary filter, so until you have exceeded the set value the hedging system will not make corrections independently of any other setting frequency.

There are available price filter in order to avoid problem with price exposed by the market maker .
| As indicated a check on bid-ask option price price and on the last of the underlying is always effectuate in order to ensure the correct data flow between the broker and iceberg |

A preview of the instrumets used to hedge the delta and related quantity at market (Qty) and the quantity that should be used to neutralize the delta (Hedge Qty).
Iceberg records every hedging operation in order to premise the user to analize the settings and to optimize the hedging strategy.
| Open the submenu strategy | |
| It allows to create a new strategy | |
| It allows to open a strategy previusly saved | |
| It allows to save the strategy actually in use | |
| Open the window Strategy Settings for the strategy settings | |
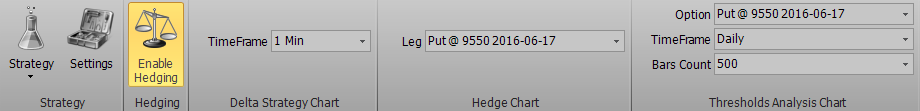
| enable or disable Hedging | |
| Timeframe | it is possible to choose the timeframe of the graph which represents the Delta | |
| Leg | It is possible to choose the instrument for delta hedging, see the graph with profit/loss and the number of contract of delta hedging | |
| Option | It is possible to choose which option of the strategy the threshold are showed on the underlying graph | |
| Timeframe | It is possible to choose which timeframe of the underlying graph the threshold are showed | |
| Bars Count | It is possible to choose how many bars are showed in the underlying graph | |

In this graph is visualized the delta value of the hedging strategy since it was activated. From the menu you can choose the time frame of the graph.

This graph shows the number of contracts used in every operations of hedging since hedging was activated. From the menu Hedge chart it is possible to choose, which instrument used to hedge is displayed .

With reference to the chosen instrument in hedge Chart, in this graph are represented all profit / loss related to delta hedging operations.

In the graph is displayed Thresholds Analysis of the historical graph of the underlying (timeframe e bars count can be selected dal menù Thresholds Analysisi Chart) with the threshold set for the selected option in the menù Thresholds Analysis Chart.
This chart is very useful to analyze the position of the thresholds setted in relation to the number of times that have been touched.

A useful report, accompanied by the underlying tick chart, it provides the user a clear view on the performance of its delta hedging settings.

 Mostra, modifica libro (
 Aiuto
Aiuto