

How to use the Manual
Quick Guide
Video Tutorial
Iceberg Features
In-depth analysis
Brokers
Data Feed
Other Manuals of beeTrader Trading Platform
How to use the Manual
Quick Guide
Video Tutorial
Iceberg Features
In-depth analysis
Brokers
Data Feed
Other Manuals of beeTrader Trading Platform
 Aggiungi questa pagina al tuo libro
  Rimuovi questa pagina dal tuo libro
 Questa è una vecchia versione del documento!
The General section contains in a single window all the commands to create, edit and interact with your Strategy, we see below details of the available commands.

 | opens the submenu Strategy | |
 | it allows to create a new Strategy | |
 | it allows to open a previously saved Strategy | |
 | it allows to save the Strategy currently in use | |
 | open the window Strategy Settings for the settings of the strategy | |
 | it allows to start the Montecarlo Simulation with the strategy parameters | |
 | it allows to choose the underlying on which create the Strategy | |
 | it allows to add to the underlying futures or ETF to the Strategy, also for hedging operations | |
 | it allows to upload the porfolio's position of the selected underlying. The positions are loaded directly from the broker on which you are connected | |
 | it allows to filter the expires visible on the Options Chain. For more informations on Options Chain Click here | |
 | it allows to filter visible strike Options Chain. For more informations on Options Chain Click here | |
 | it allows to delete changes into expirys filters and / or strikes and return to the default display | |
 | opens the submenu Market Maker Surfaces the tool that allows the processing of the volatility surfaces on on which calculated theoretical prices | |
 | it allows to start the Market Maker Surfaces for the underlying selected to take the actual volatility surface from the market | |
 | it allows to start the Market Maker Surfaces for the selected underlying e and use the surface previously saved | |
 | it allows to save the current workspace to use it in the future | |
For more informations on Options Chain Click here
 | it allows to execute orders in Paper Trading. For more information on how to enter orders with Iceberg, click here | |
 | it allows to execute orders in Real Market. For more information on how to enter orders with Iceberg, click here | |
| it allows to cancel the execution of orders | ||
 | opens the Template submenu | |
 | it allows you to save the template of Payoff currently in use. The template is the configuration of the Payoff | |
 | it allows you to load templates previously saved and apply them to the currently Payoff in use | |
 | it allows you to save the current template as the default for subsequent Payoff | |
 | it allows you to reset the zoom and then return to the original display | |
 | it allows you to enable or disable the Crosshair for Payoff | |
 | it allows you to save the Payoff of Strategy currently in use in image format (* .png). The image will be saved to the Pictures folder of beeTrader, in the user's Documents | |
 | it allows you to print the Payoff of Strategy currently in use. Feature available on the PC with a printer | |
The tab is divided into five main areas which we will describe briefly in this chapter. For each section there is a special page of the manual with a detailed description, with particular attention to all functions available from the right button's menu.
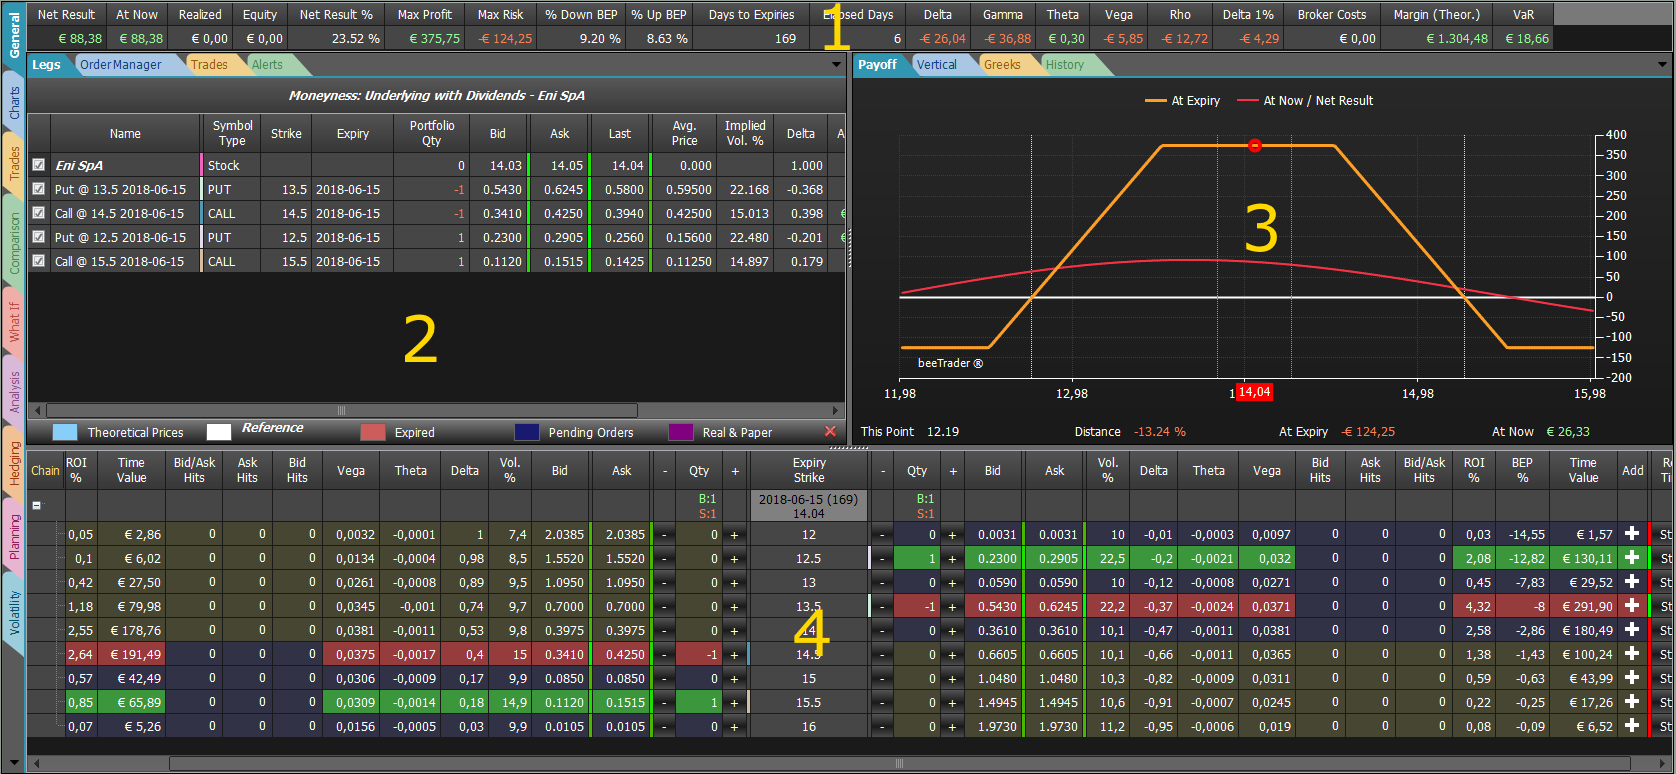
The topmost part of the General tab displays the properties of the strategy as a whole, so with all the parts that make it up (leg and underlying both).

By clicking the right mouse button you can access to the following menu:
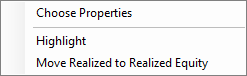 | - Choose Properties: Opens the Choose Properties to choose which properties are shown. in the chapter below the list of available properties - Highlight: allows you to enable / disable the highlight when there is an update of each properties - Move Realized Realized to Equity: this command is present only if in the strategy there is a consolidated (positive or negative), and it allows to transfer the amount consolidated in the property “Realized Equity”, then the consolidated amount will no longer be considered in the calculations, and the payoff strategy, it remains present in the Trades and graph Greek Realized |
For a list of available properties and their explanation, click qui.
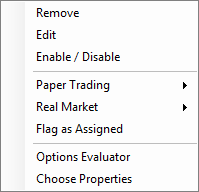
This section is the heart of the strategy. There are listed, for each underlying, all legs that have been treated or are at market. A lot of functions are accessible by the right mouse button, for more information click here.
 |
 |
 |
 |
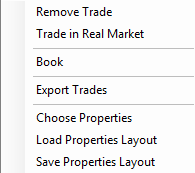
In this section they are listed in chronological order. For each trade is listed all information calculated when the order is registered. Each cell could be edited by double-clicking the mouse. Particular attention should be paid to “Filled Type” and “Filled Quantity”. Filled Type indicates the manner in which the order has been registered, it can be paper trading or real market, clicking on the cell with the left mouse button you can change this parameter. Box Filled Quantity remain blue until the order is executed in paper trading or real market. It is also provided a full view, you can access to the full view by using vertical tabs at the left of the software. For more information on the complete view click here.
In this area is also available Order Manager, a console where there are orders sent to the market, you can cancel or change them. Once an order is executed in Real Market it is saved in the Trades.
 |
The Options Chain is automatically downloaded from the broker once it is selected the underlying. It is fully customizable, in fact you can choose strikes and expires as well as options' property to be visualized. All settings can be selected from the menu available clicking right mouse button. Any transaction which is done on the Options Chain is immediately displayed on the payoff. For more, click here.
The Payoff immediately displays the operations that are carried out on the chain options. It is fully customizable through the menu accessible with right mouse button. it is equipped with many graphical tools, such as the individual legs view, the Greek charts, the atnow line, the lines corresponding to the standard deviations and the DPD Forecast Map. It is also provided a full view, you can access to the full view by using vertical tabs at the left of the software. For more information on the complete view click here.

 Mostra, modifica libro (
 Aiuto
Aiuto 

