

How to use the Manual
Quick Guide
Video Tutorial
Iceberg Features
In-depth analysis
Brokers
Data Feed
Other Manuals of beeTrader Trading Platform
How to use the Manual
Quick Guide
Video Tutorial
Iceberg Features
In-depth analysis
Brokers
Data Feed
Other Manuals of beeTrader Trading Platform
 Aggiungi questa pagina al tuo libro
  Rimuovi questa pagina dal tuo libro
 Questa è una vecchia versione del documento!
This tool allow to compare the historical graph of two assets. The two time series are normalized for a better view. For both titles is displayied the corresponding Volatility Index.
Four charts are shown, each one can be selected or deselected by clicking on the name at the top.
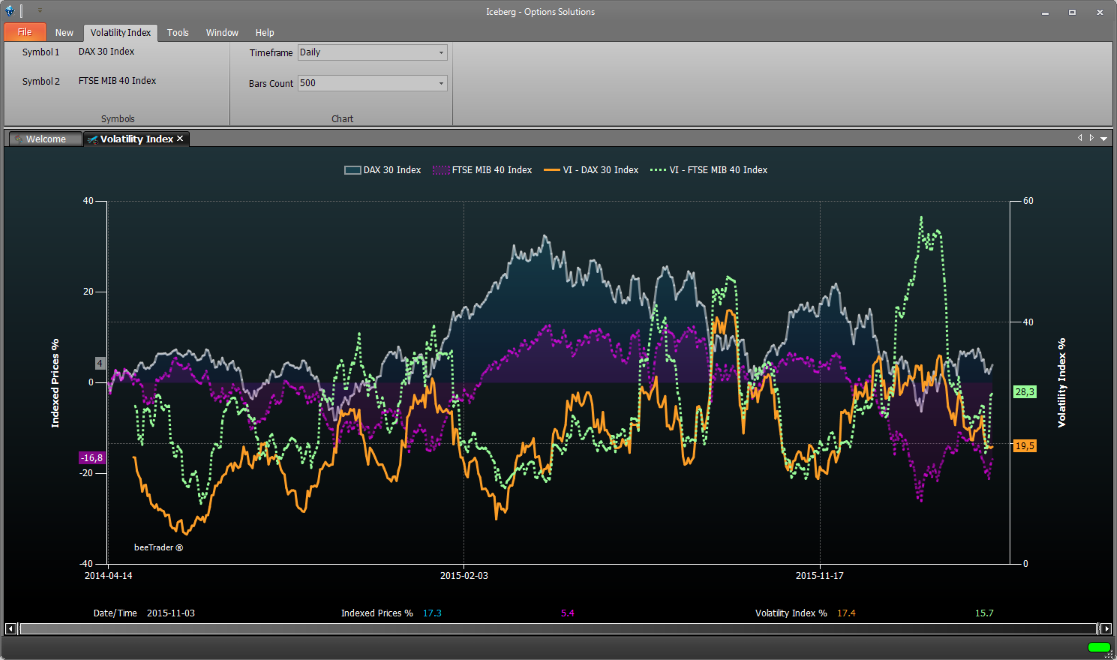
The known Volatility index inform when volatity goes up or down, conversely the volatility index built in Iceberg show whether is priced an up trend or a down trend!
This is more and more useful than the standard index!
For example if we put the crosshair on 10/11/2015, the index price a probably down trend. After we see that it happen!
If the index is above the zero it prices a down trend while the index is below the zero it prices an uptrend.
The Iceberg's volatility index is an interpolation of implied volatility but it are not the midpoint of weighted volatility. It is different from VIX or VDAX o VSTOXX. It reflect the trend priced by Market Maker
For example during fall in volatility, the index can rise, this is due to the fact that the “conviction” of an uptrend is decreasing
The value expressed by classic index can be obtained through the mean of the implied volatility of the three option “approximately” ATM measured on the three-month expire.
If the underlying is at 103 and the strikes have step 5 you take the implied of : 100, 105, 110
If the underlying is at 102 and the strikes have step 5 you take the implied of : 95, 100, 105
The Volatility Index in Iceberg is unique and it is under patent request.
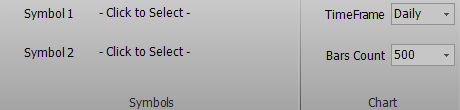
| Symbol 1 | Clicking on “Click to Select” it is possible to select the first instrument to buy |
| Symbol 2 | Clicking on “Click to Select” it is possible to select the second instrument to buy |
| TimeFrame | It allows you to choose the timeframe of the graph |
| Bars Count | It allows you to choose the numeber of bars to visualize |

 Mostra, modifica libro (
 Aiuto
Aiuto 