

How to use the Manual
Quick Guide
Video Tutorial
Iceberg Features
In-depth analysis
Brokers
Data Feed
Other Manuals of beeTrader Trading Platform
How to use the Manual
Quick Guide
Video Tutorial
Iceberg Features
In-depth analysis
Brokers
Data Feed
Other Manuals of beeTrader Trading Platform
 Aggiungi questa pagina al tuo libro
  Rimuovi questa pagina dal tuo libro
 Questa è una vecchia versione del documento!
This section of the strategy gives the chance to study the implied volatility of the options. It is composed of five parts: Volatility Index, Options Smile, Skewness, I.V. - Realtime, and eventually Vega IN / OUT.
 |  |  |  |  |
 | 24/03/2016 | Volatility - Cos'è la volatilità e lo smile - Didattico | 13:27 |  |
| 24/03/2016 | Volatility - Cos'è la superficie di volatilità - Didattico | 13:58 | |
| 13/10/2016 | Volatility - Volatility Index - Difference | 7:16 | |
| 13/10/2016 | Volatility - Volatility Index - Oscillator | 7:19 | |
| 13/10/2016 | Volatility - Skew & Surfaces | 14:01 | |
| 13/10/2016 | Volatility - I.V. Realtime | 6:18 | |
| 19/05/2016 | Volatility - Volatility - Come individuare il Trend [Parte 1] | 14:35 | |
| 19/05/2016 | Volatility - Volatility - Come individuare il Trend [Parte 2] | 17:03 | |
| 29/11/2016 | Volatility - Stima della volatilità implicita | 13:22 | |
| 02/12/2016 | Volatility - Comparazione Implied Volatility | 8:43 | |
| 24/03/2016 | Volatility Index Comparison | 10:25 | |
Click here to see other Video di Iceberg
 | it open the submenu Strategy | |
 | it creates a new Strategy | |
 | it allows you to open a previously saved Strategy | |
 | it allows you to save the Strategy currently in use | |
 | it open the window Strategy Settings for the strategy settings | |
 | it enable the receiving of realtime data for Chart 1, The real time is allowed for only one chart at a time |
 | it set the real time curve as sample. This allow to study the changing of the curve in relation to the sampled |
| it enable the receiving of realtime data for Chart 2, The real time is allowed for only one chart at a time |
| it set the real time curve as sample. This allow to study the changing of the curve in relation to the sampled |
 | it enable or disable the Crosshair in Chart 1 and Chart 2 | |
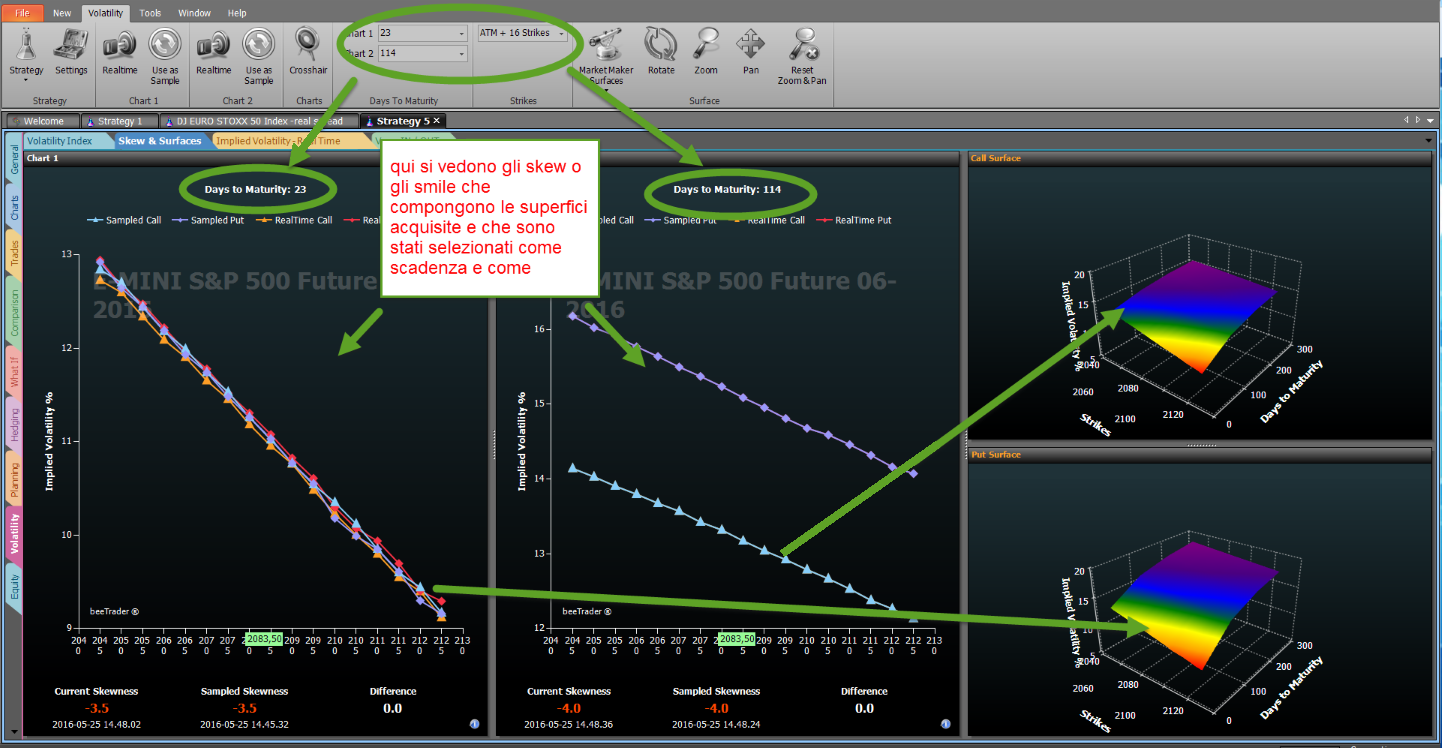
| Chart 1 | ot allows you to select the number of days to maturity of Chart 1 |
| Chart 2 | ot allows you to select the number of days to maturity of Chart 2 |
| Strikes |
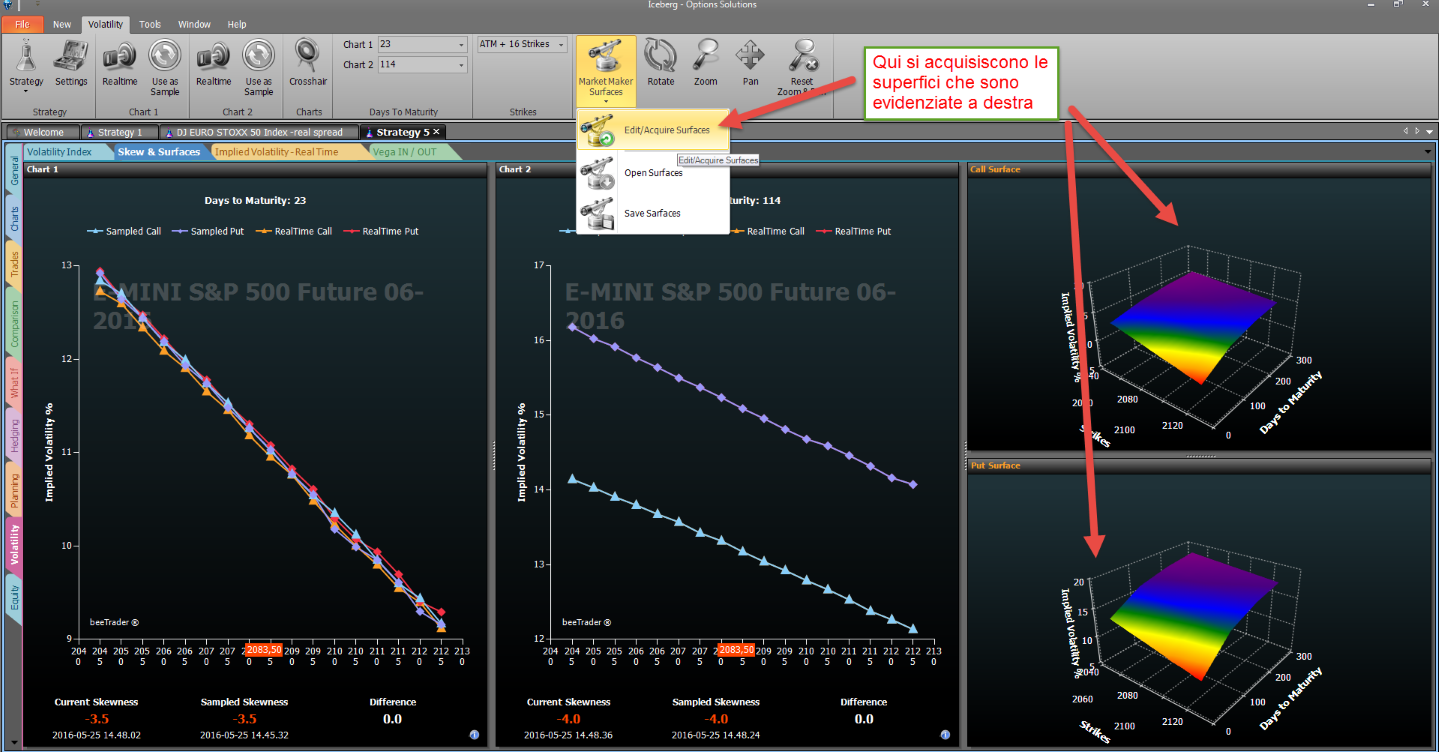
| Market Maker Surfaces | ot allows you to acquire the market volatility surface, open a saved or saved the current one. For more information on Market Maker Surfaces, Click qui | |
 | once activated by pressing and holding the left mouse button you can rotate the surface by moving the mouse | |
 | once activated by pressing and holding the left mouse button you can zoom into the surface by moving the mouse | |
 | once activated by pressing and holding the left mouse button you can move the surface by moving the mouse | |
 | it reset all graphical changes and return to the initial view | |
| Difference | V.I. Oscillator |
|---|---|
 |  |
 |  |
The Volatility Index which are in Iceberg is calculated with a proprietary algorithm that tends to absorb quickly the outliers, the spike in implied volatility on all or portions of options that make the measurement.
This calculated is necessarily different from the volatility indexes that are quoted on the market or calculated by other software.
We wanted to move forward and, beyond the final issue, what we were interested in was having a set of calculations that would allow us more efficient evaluations.
We extended to all traded instruments and you can find it on the stocks, currencies, and futures on bonds.
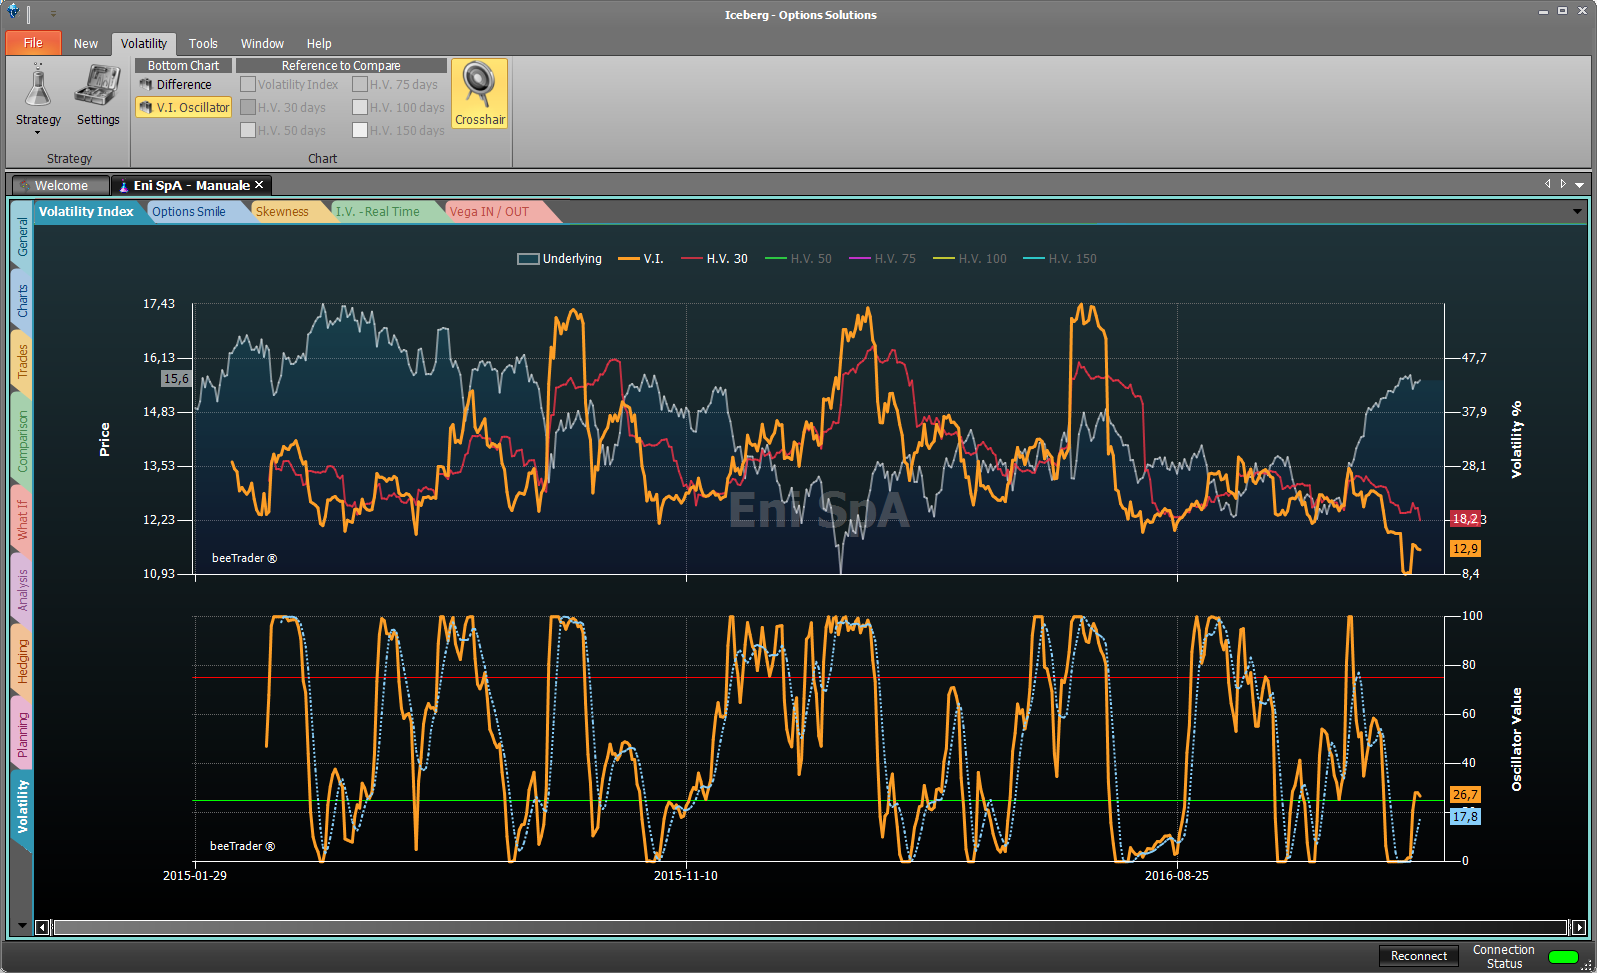
This mode allows to estimate the difference between the Volatility Index and historical stock volatility relative to 30,50,75,100,150 periods such as the difference between each historical volatility and another of a different period.
Analyzing with the Volatility Index is important to determine if Market Maker is pricing (implied volatility) greater or lesser than historical volatility and therefore you know whether you will be handling discount or bonus options.
The analysis of historical volatilities is important, however, to understand the trend and the level of value of historical volatility..

In the above example shows the difference between the historical volatility at 30 days (selected in the menu Reference to Compare) with the historical volatility at 75 days displayed in the top graph.
The Volatility Index can also be displayed as an oscillator, this type of display makes it easier to read and therefore decide if it is high or low volatility.
Consider the empty spaces left by the indicator as shown, and in this way you will avoid many false signals.
Since you are creating a relationship volatility-trend must understand that it will be long term and not for a day trading. It takes a position and is kept until the opposite signal.
See in the image as in one year of measurements positions and the related changes would be only 6 with very few false signals (3) of very short duration.
The green arrows on the chart indicate trends and Long are at the zone, located on the oscillator, to consider.
Quelle rosse indicano trend Short.

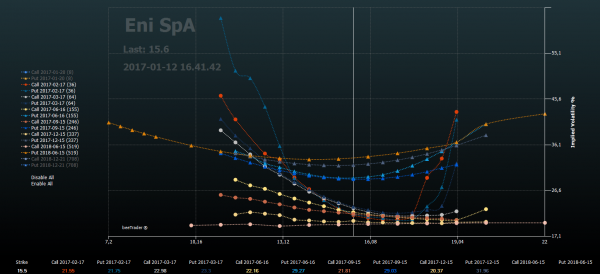
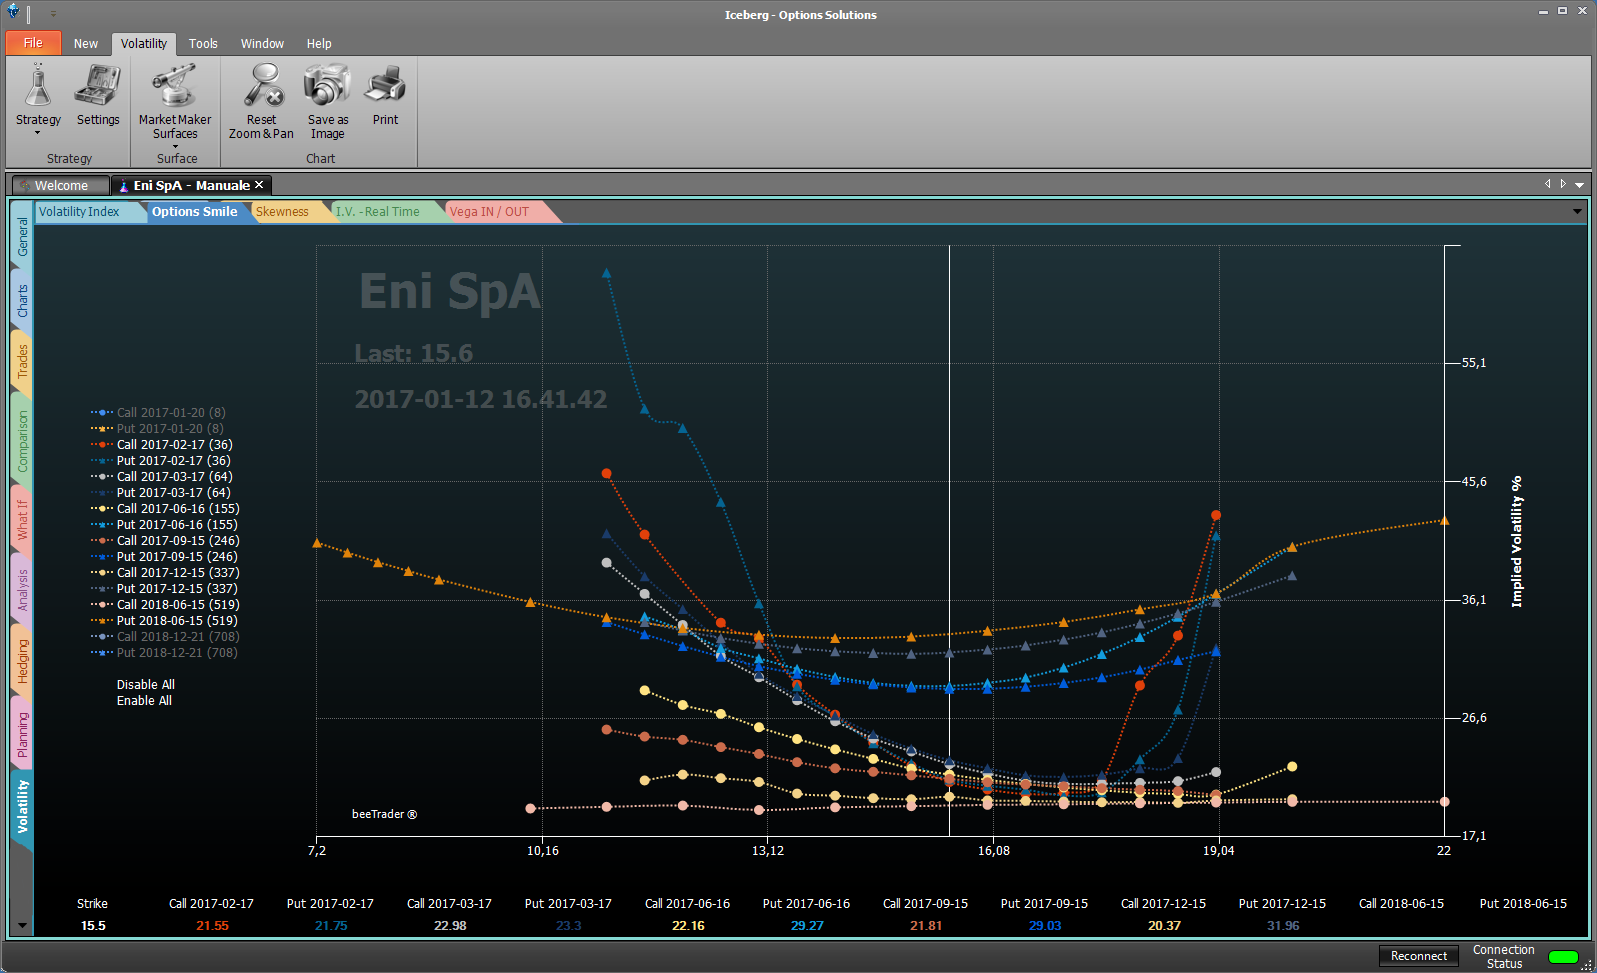
Options Smile shows the smile of volatility of call and put options of the surface stored for the underlying, in this regard is indicated when they refer to the displayed smile. If there is no curve the skews are flat and you need to acquire a surface with the tool Market Maker Surfaces available from the menù.

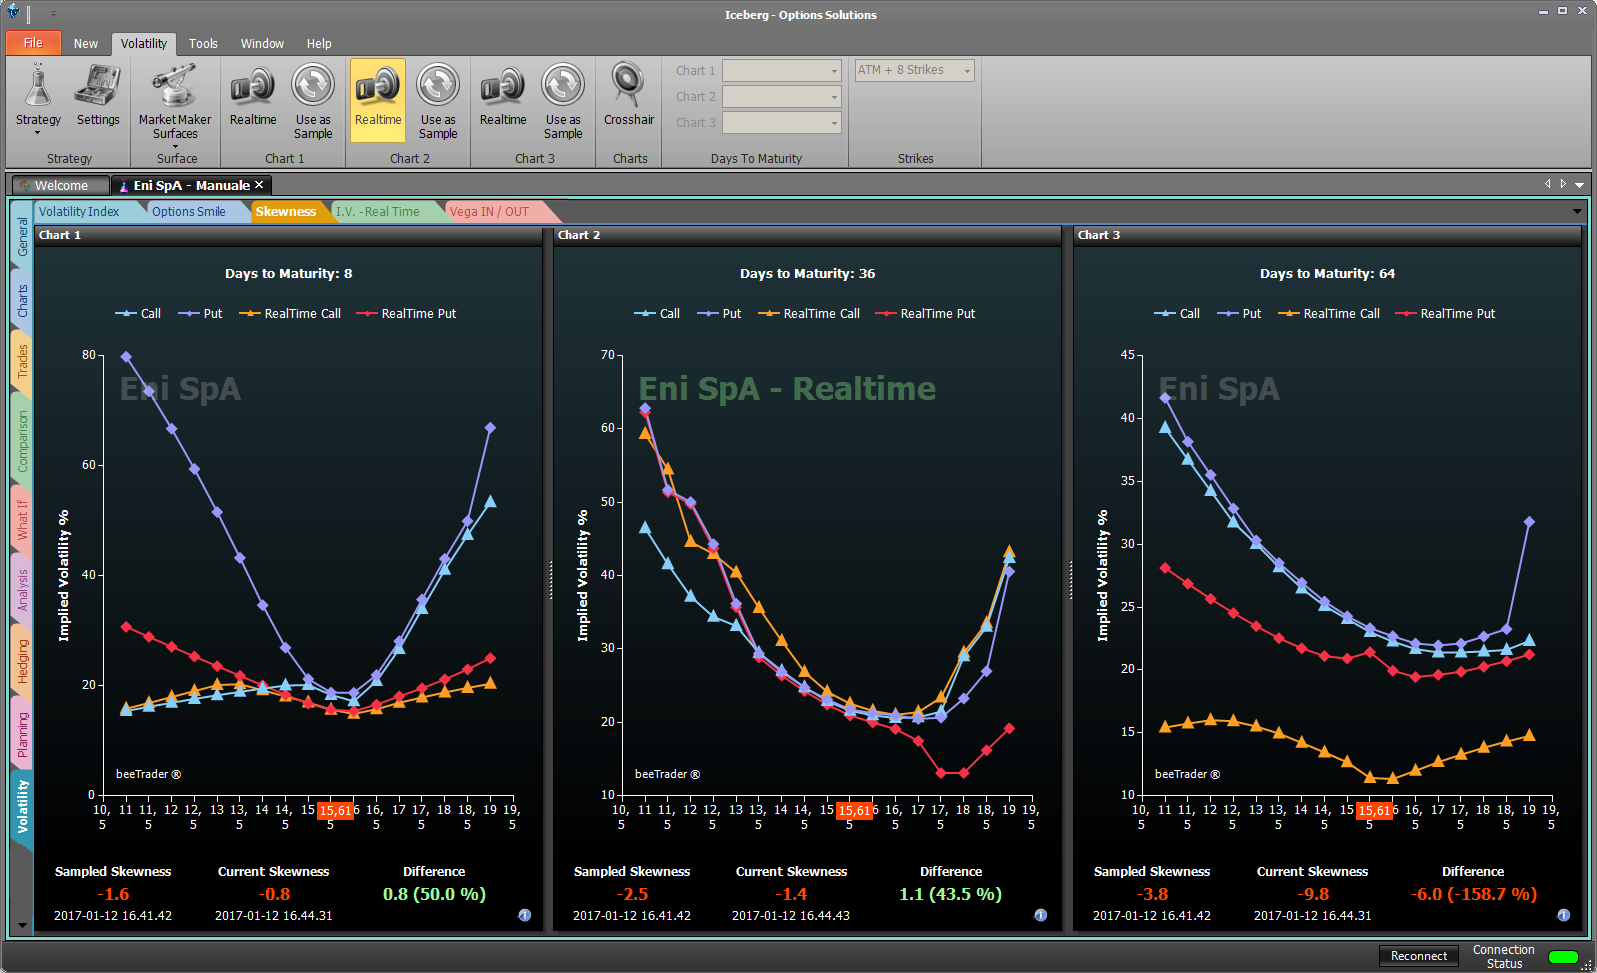
“Skew & Surfaces” allows real-time assessment of differences of skewness slope to the desired expiries. Show default the skew of the surface stored for the underlying. If there is no curve the skews are flat and you need to acquire a surface with the tool Market Maker Surfaces available from the menù.
There are four graph: Chart 1, Chart 2, Call Surface e Put Surface.
The area below the graphs Chart 1 and Chart 2 is devoted to a comparison between the stored and current skewness.
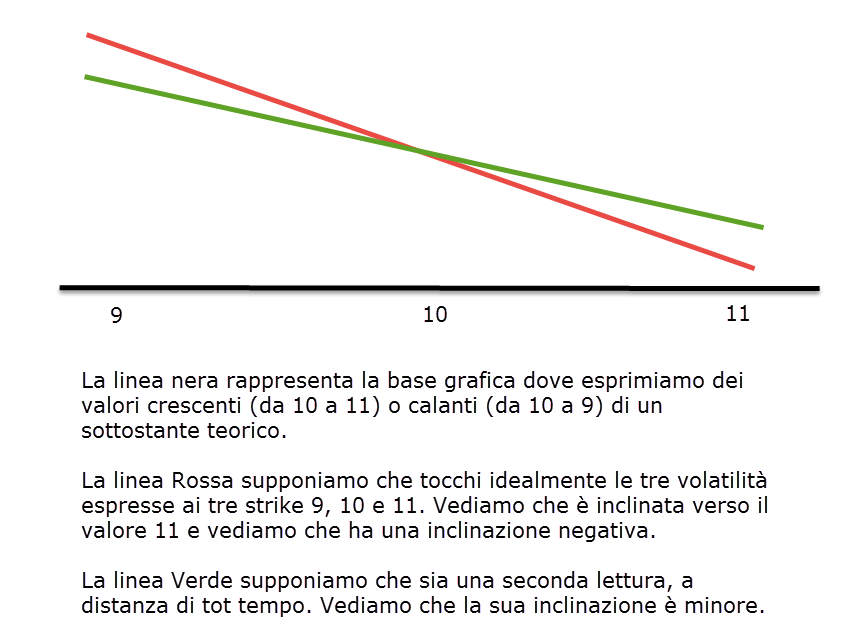
The skewness has always a negative slope beacause the market price highter a down trend than an up trend.
So we can say that an highter negative slope suggests a down trend while a less negative slope suggests a up trend .
Therefore it is an excellent tool to forecast the very short-term trend indeed the slope anticipates the movement of the underlying as it is determined by market makers.
In general, the skewness should never be positive and the volatility values that make up the smile of the Call must be lower than the smile of Puts. If there are no such conditions then it means we are doing an analysis in special conditions that will line up in a few minutes so we expect that the MM will reset their curves.
There are exception: all volatility indices and the commodities. For those instruments the reading is conversely beacause they can't reach to zero.
The skewness in these securities must not be negative and the volatility values that make up the smile of the call must be higher than the smile of the put.
Below the values of Current Skewness and Sampled Skewness there are the time references while in the menu there are commands to select the expires to be displayed and which of these put in real time and compare. You can assess the “Difference” in order to detect the short-term trend as explained above
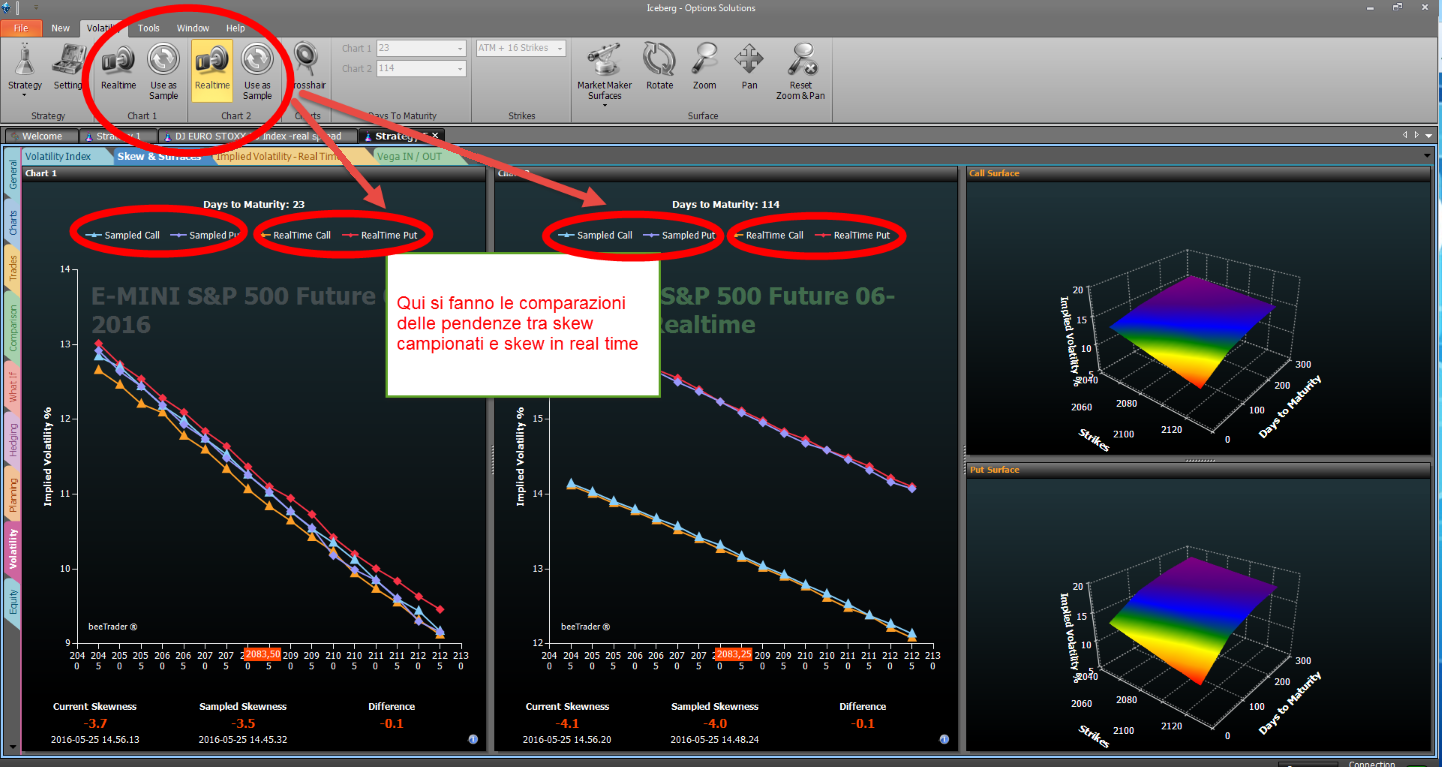
Note: The comparisons can be made importing volatility surfaces saved months before or you can compare very close slopes to check the movement of the underlying in the short term.
- First we take vision of the current trend
- After we take a sample and we will have a value of slope.
- Then we carry out a second sampling after few hours and we could have three results:
- Same slope: il significato è che il trend continua nella stessa direzione senza tanta velocità.
- More negative slope: the market has increased the speed of the short trend or decreased the speed of the long one
- Less negative slope: the market has decreased the speed of the short trend or increased the speed of the long one

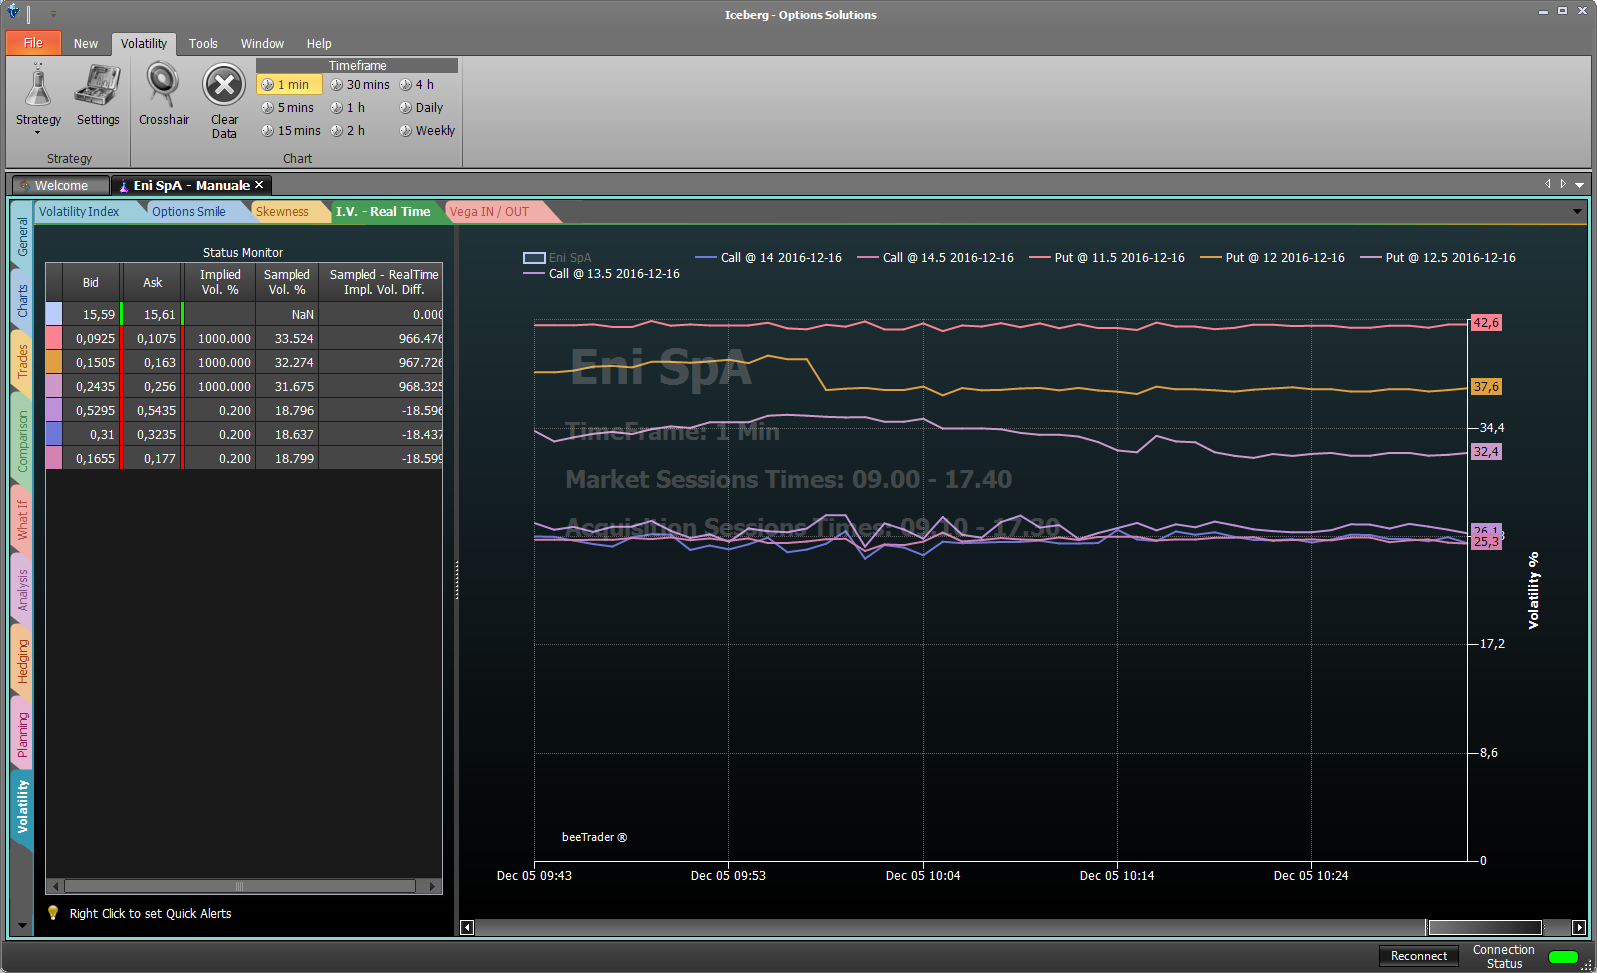
This graph shows the implied volatility of the legs present in the Strategy and the underlying. Each legs is represented with the same color associated with it in the strategy.
The user can enable or disable the display of the legs by clicking on the name of the same at the top.
There some function available: the selection of the timeframe, the possibility to delete the history and start ex-novo with data visualization and the possibility to set a Quick Alert just clicking the right mouse button on the cell of interest.
When the strategy is open all data received of each leg are stored. Doing this every user can create a history of the implied volatility of the options that are dealing with.
Sampled Vol. % refers to the volatility measured at the point where it was clicked on the chart.

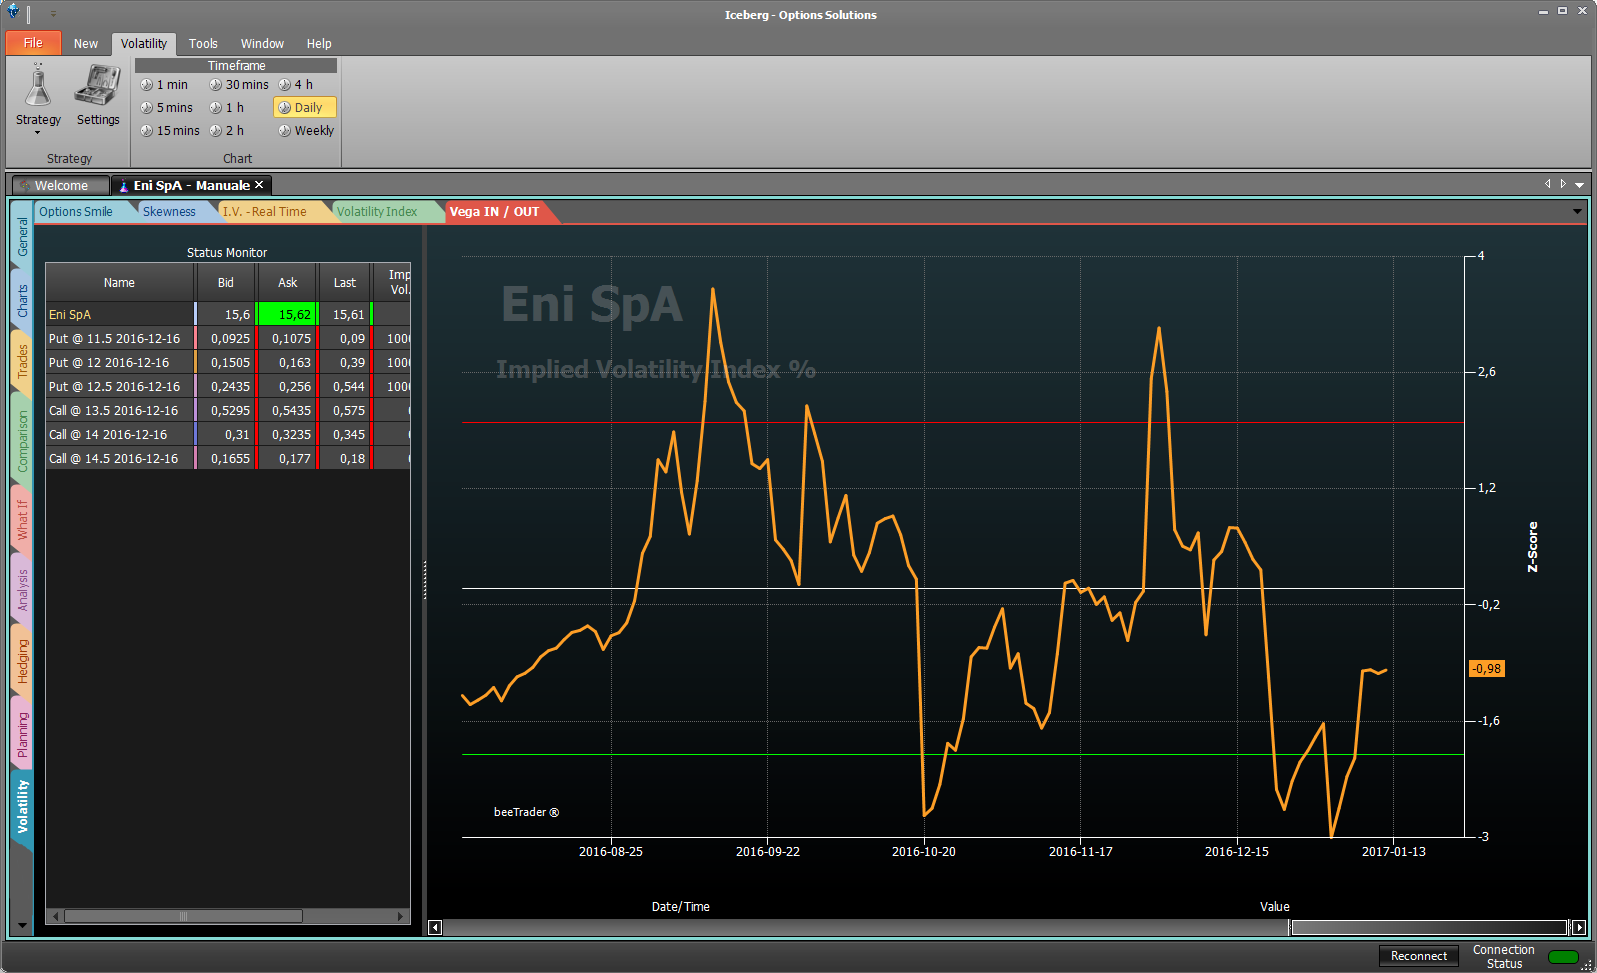
This tool, given exclusive to the participants of the presentation of Iceberg has been designed and developed to take advantage of volatility retracements from peaks identified by Volatility Index.
In the literature we read that we have to sell when the volatility is high and buy when it is low. But this information can cause losses. In fact, the volaility must be sold when it is falling and bought when it is going up. It may seem a small difference, but it is substantial. This is shown by the tool Vega IN / OUT!
For example, you can sell a straddle when the volatility index cross from top to bottom the line 2. You have to sell Calls e Puts on a long expire (1,5 - 2 years) with a low delta, around 0.2. Doing this the figure will be less affected by the movements of the underlying and it will gain from the lowering of vega.
In case the underlying has a wide excursion you have to rebalance the Delta by selling another options (Call or Put depends on the direction).
For example you can rebalance when the ratio between the loss of one leg and the gain of the other one is equal to two.
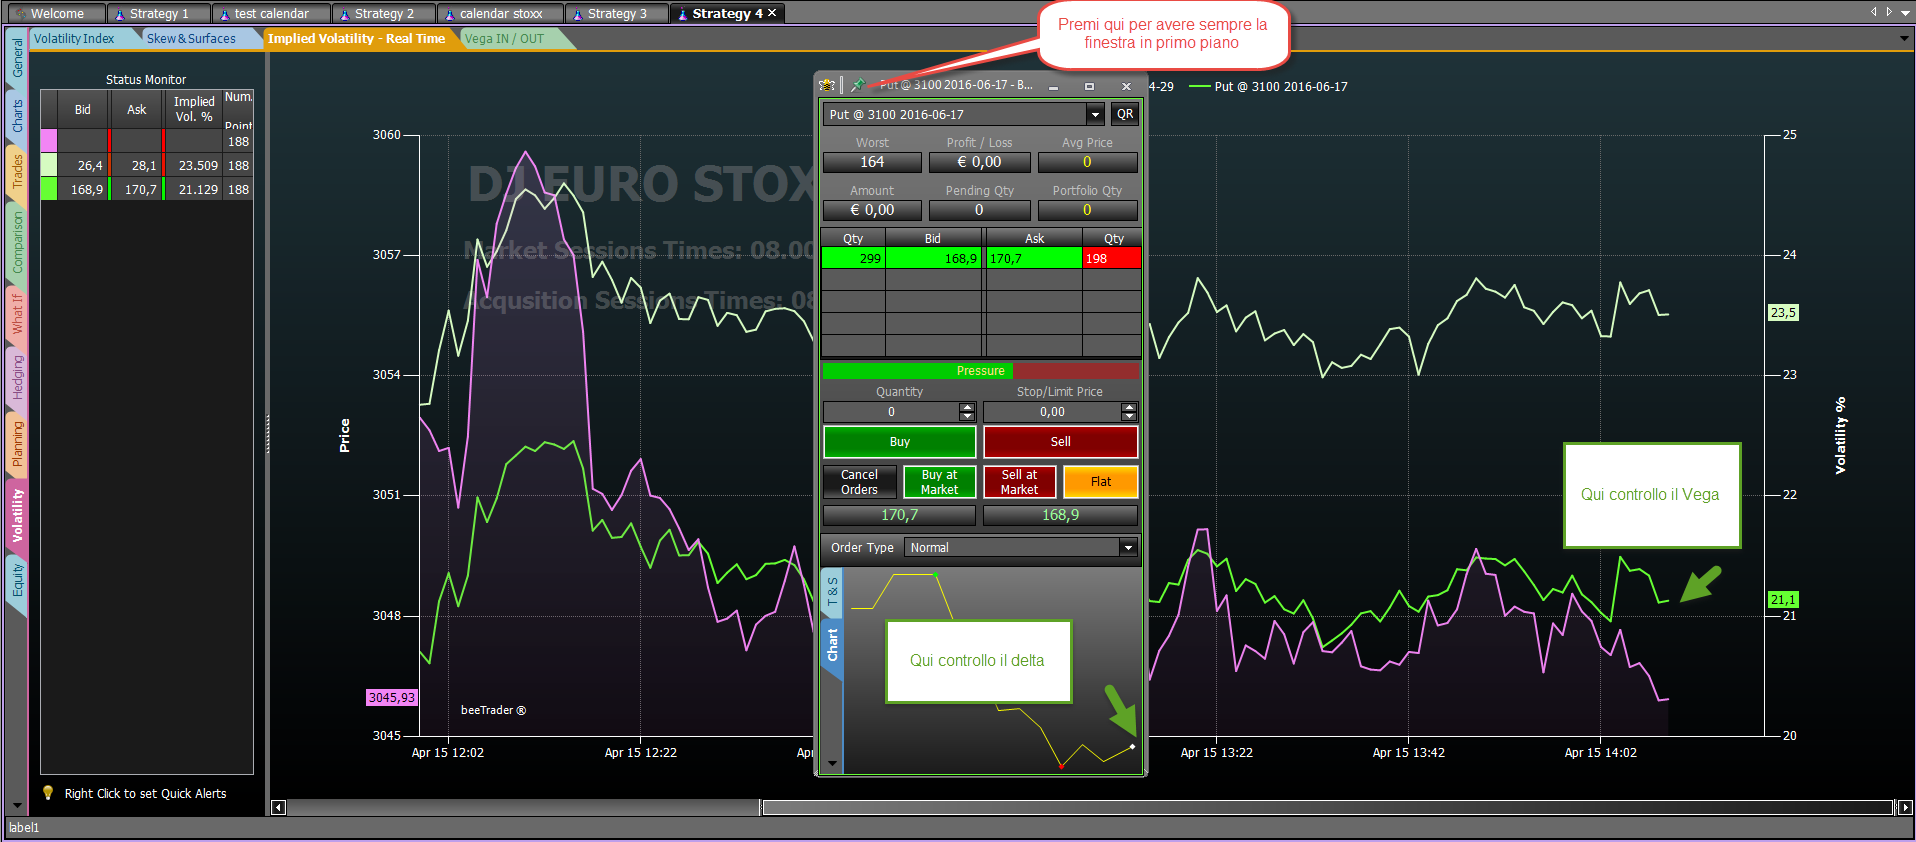
In the image we see how Iceberg can be used for trade the options with its own Book, in which you can see the trend tick by tick of the underlying e and the implied volatility of the option (Vega).

 Mostra, modifica libro (
 Aiuto
Aiuto