

How to use the Manual
Quick Guide
Video Tutorial
Iceberg Features
In-depth analysis
Brokers
Data Feed
Other Manuals of beeTrader Trading Platform
How to use the Manual
Quick Guide
Video Tutorial
Iceberg Features
In-depth analysis
Brokers
Data Feed
Other Manuals of beeTrader Trading Platform
 Aggiungi questa pagina al tuo libro
  Rimuovi questa pagina dal tuo libro
 Questa è una vecchia versione del documento!
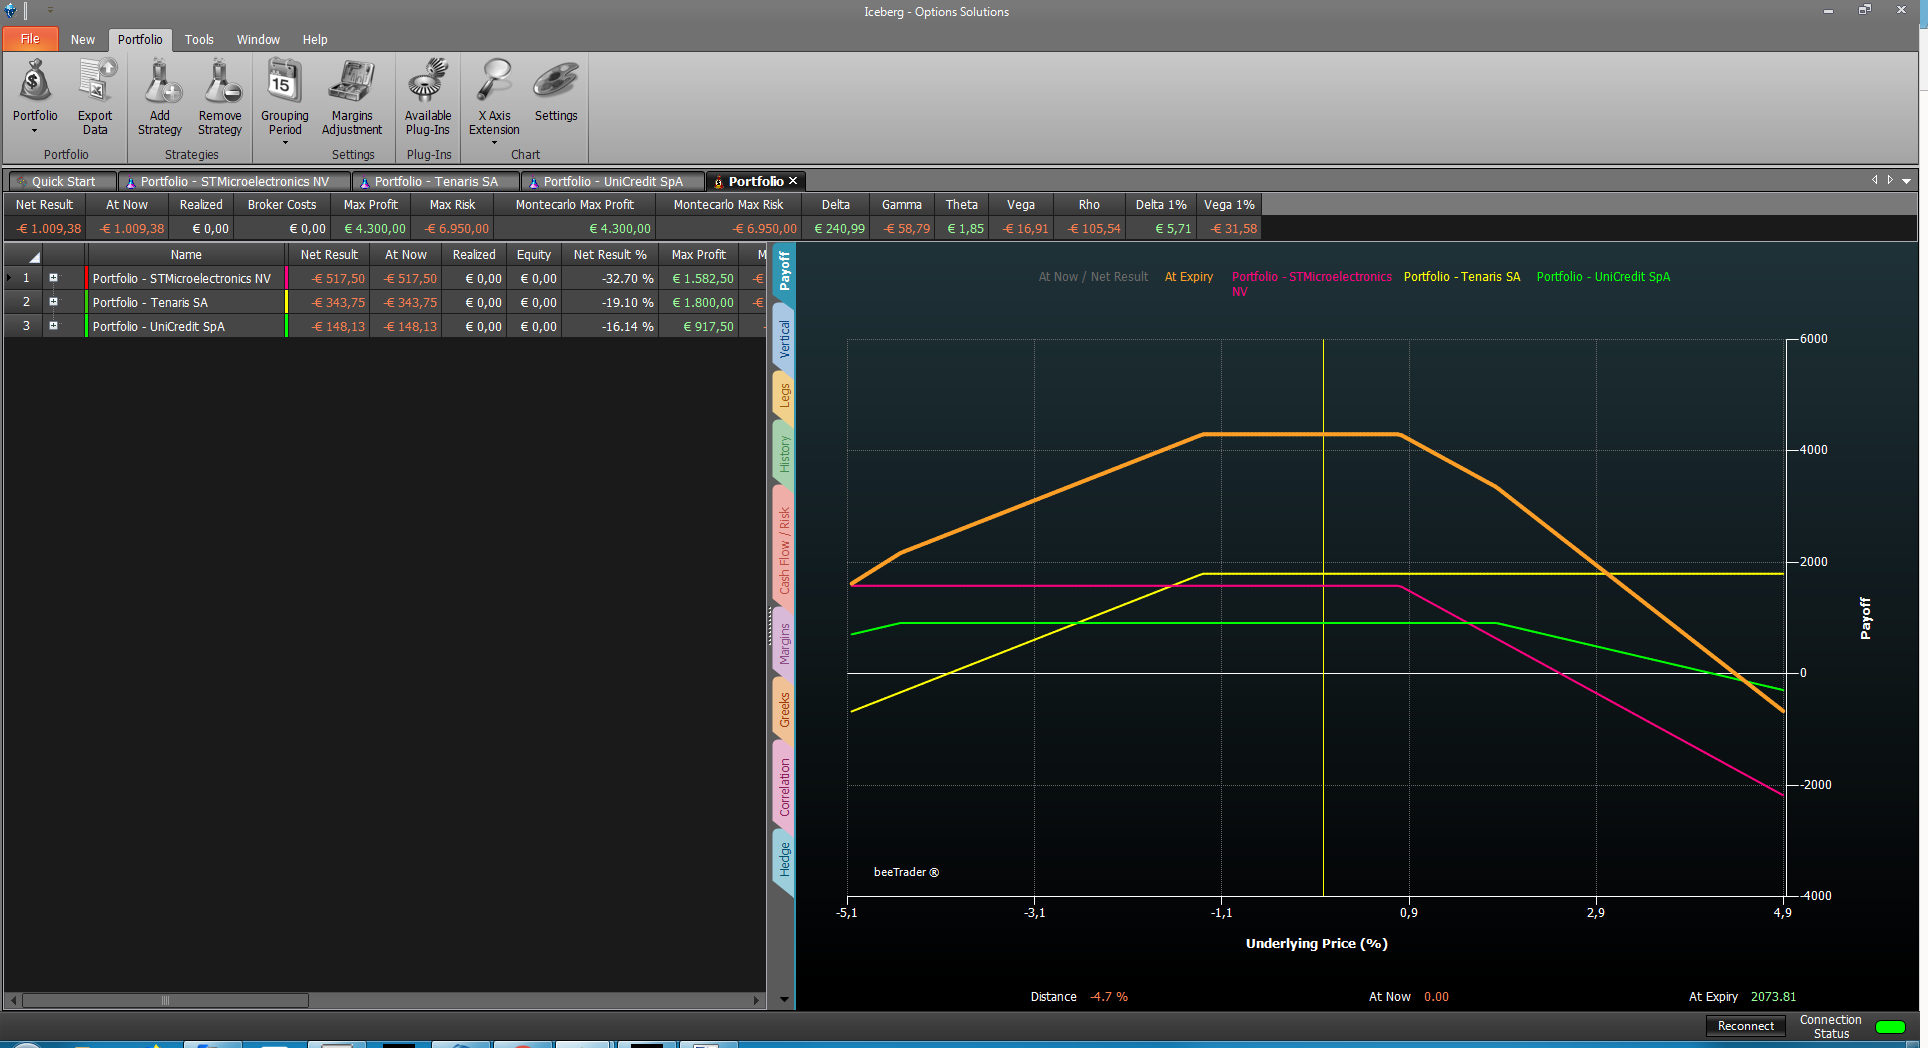
The Iceberg's portfolio has been conceived and designed to give you the overview of your strategies. The user can create different portfolios and he can include diffent strategies . The portfolio allows to know various information in real-time like the net exposure at market. Portfolio is divided into several tabs that we analyze below.
| The upper section and the left section with a list of strategies are always visible. You can add or remove properties (at this link link is available the list of properties ) |
In the example that we are going to analyze the portfolio is composed of the four strategies (Salvatore Ferragamo, Mediaset, STMicroelectronics e Tenaris) reported below .
 |  |  |  |
 | 15/09/2016 | Portfolio - Panoramica | 19:18 |  |
| 24/03/2016 | Portfolio - Il Payoff | 9:00 | |
| 24/03/2016 | Portfolio - Le Legs | 3:07 | |
| 24/03/2016 | Portfolio - Il Cashflow | 5:11 | |
| 24/03/2016 | Portfolio - I Margini | 4:44 | |
| 24/03/2016 | Portfolio - Greche e Correlazione | 8:04 | |
Click here to watch others Video di Iceberg
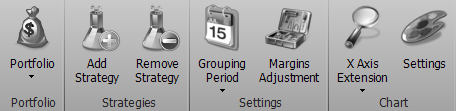
 | It opens the submenu portfolio | |
 | It creates a new portfolio | |
 | It allows you to open a previously saved Portfolio | |
 | It allows you to save the currently used Portfolio | |
 | It add a Strategy in the Portfolio currently in use | |
 | It remove a Strategy in the Portfolio currently in use | |
 | In case of strategies with weekly and monthly expires allows you to group premiums and risks | |
 | It allows you to align the margin proposed by Iceberg for the portfolio strategies with those actually required by the broker | |
 | It allows to zoom on “X” axis | |
 | It allows you to change the graphics settings of all charts | |
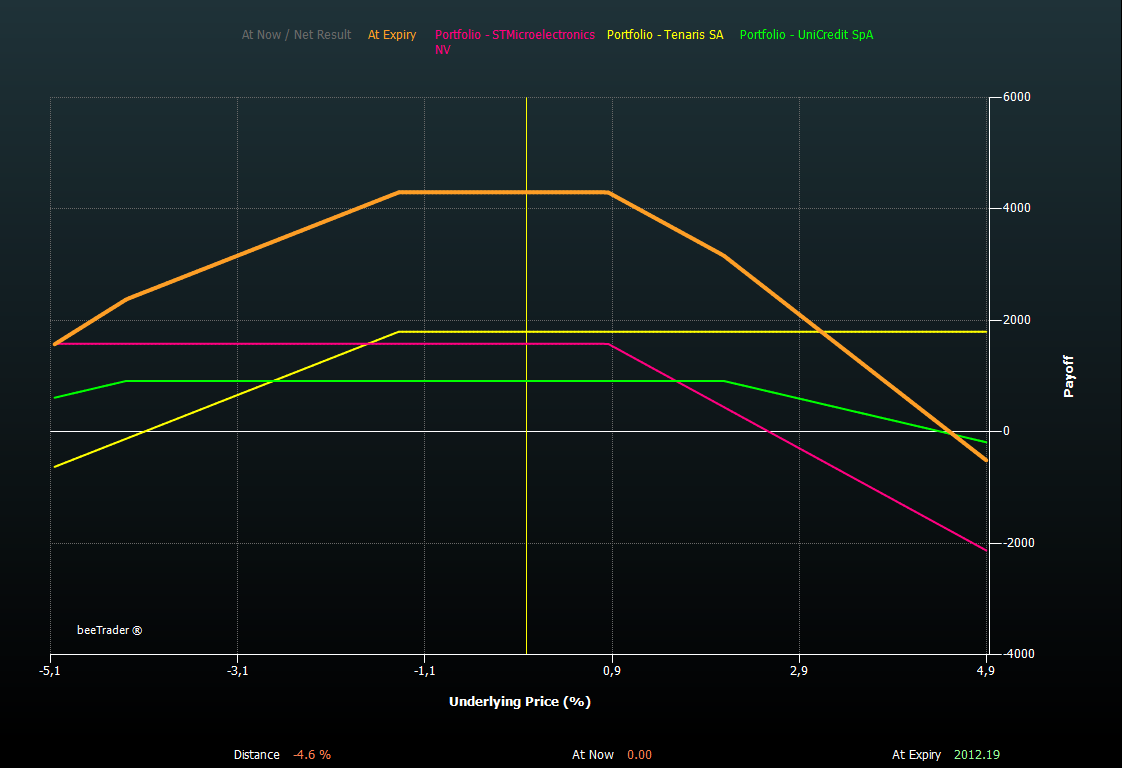
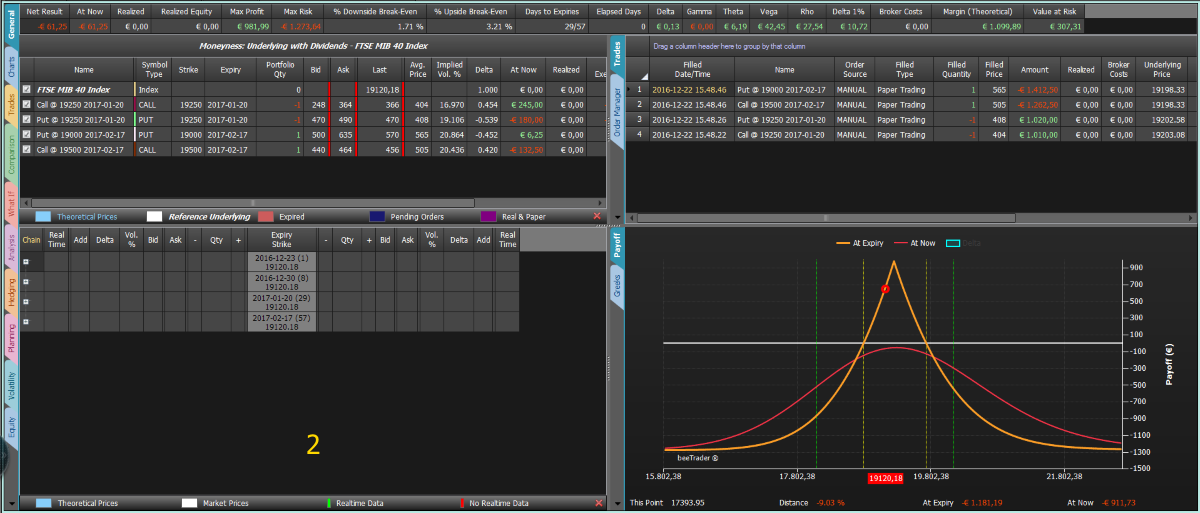
Payoff section shows the global payoff of all strategies (in order to make comparable the various underlying the prices are percentualizzati) and the payoffs of individual strategies. Every strattegy, like the payoff and the at-now, is highlighted with a color in order to render detectable immediately each strategy. By clicking on the names of the strategies (above the payoff chart) you can enable or disable the display in the chart. You can also change the color that represents the strategy directly from the window Strategy Settings of every strategy.
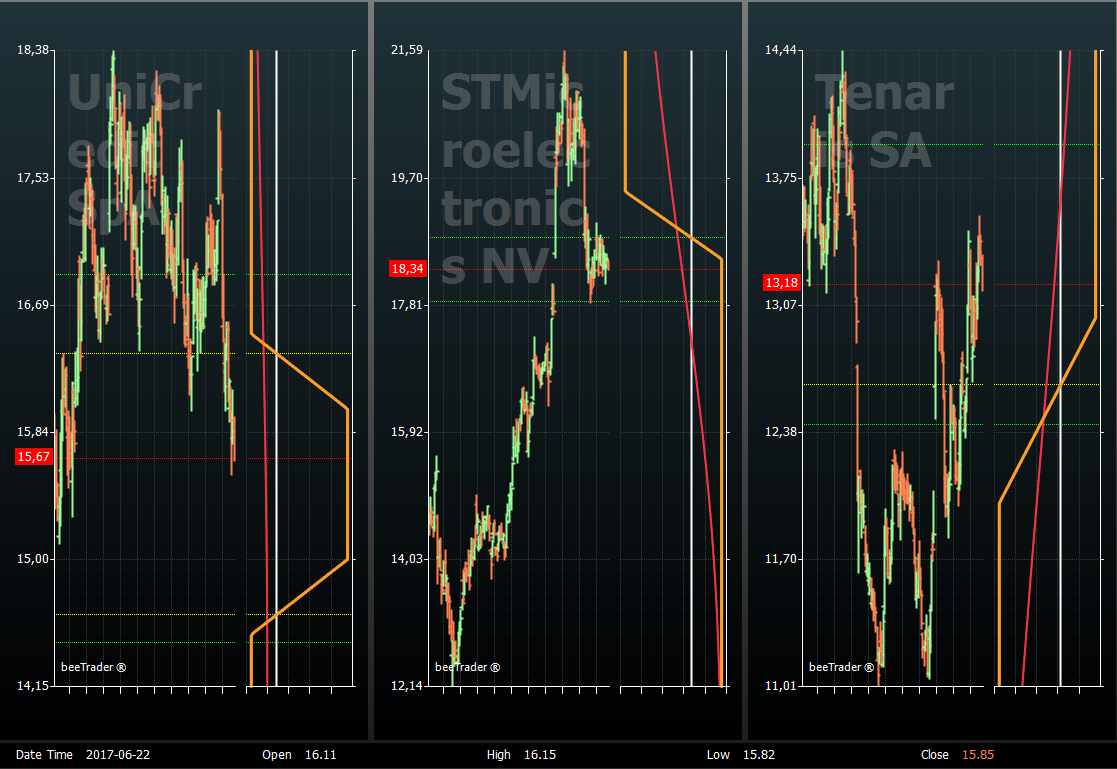
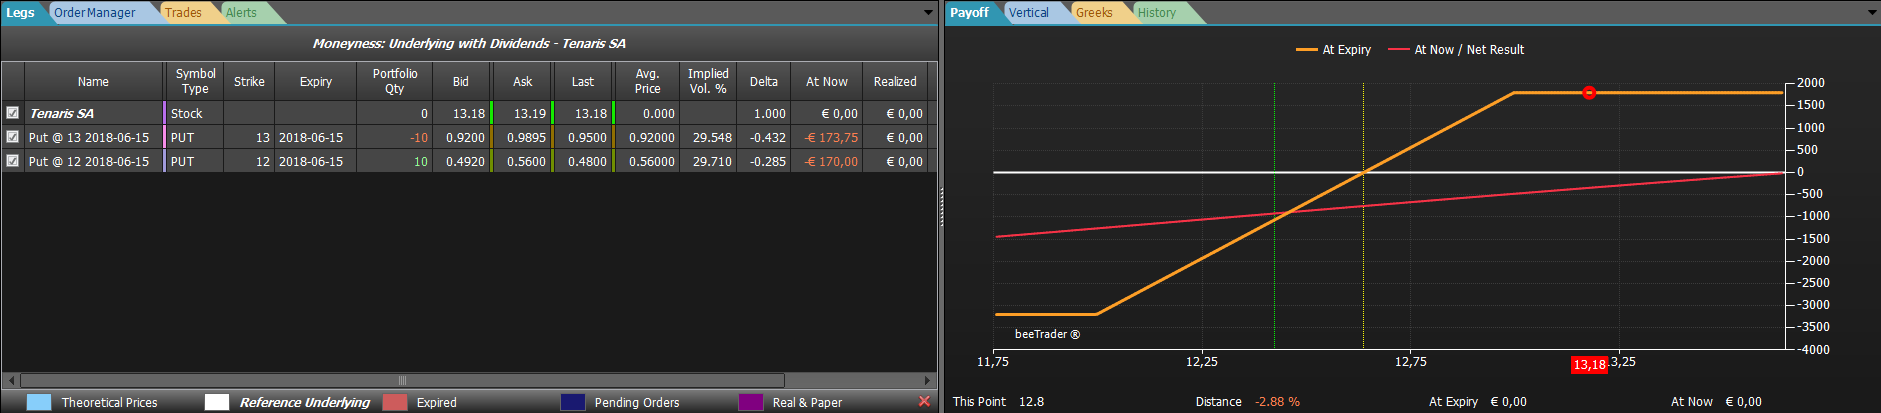
The Vertical section allows the display of all strategies contained in the Portfolio. The display is made with the historical graph of the underlying and the payoff cross. This way you can have an immediate view of your position.
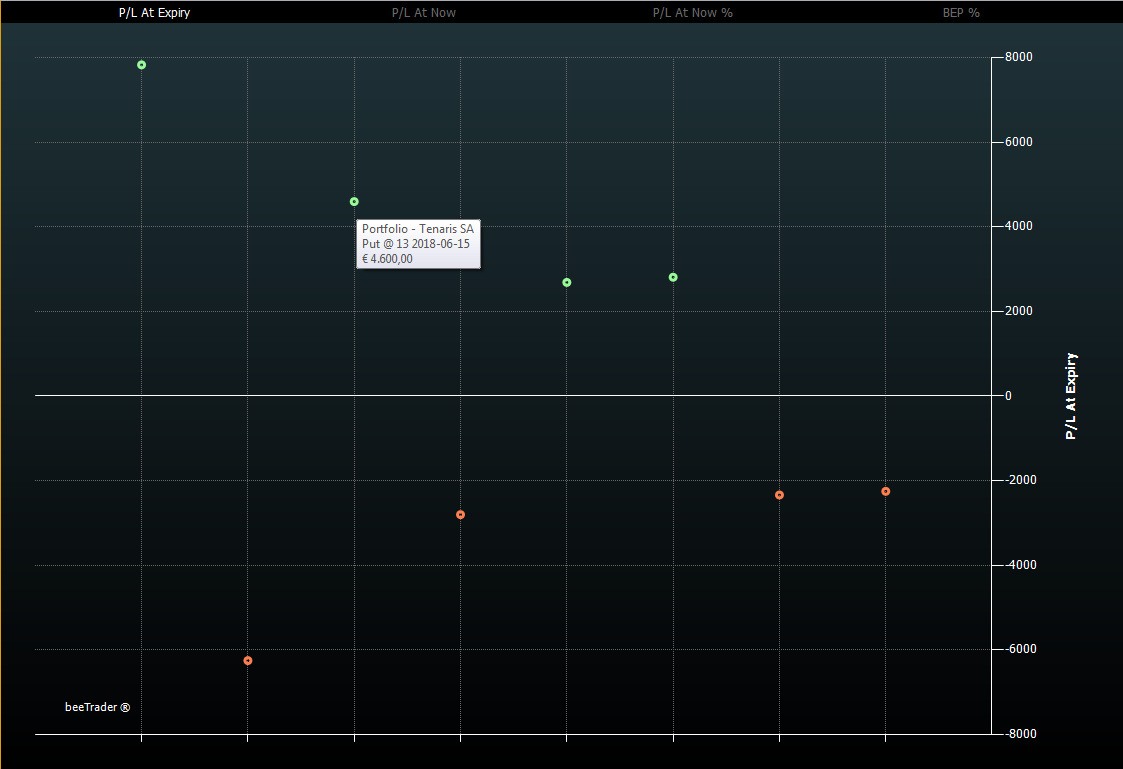
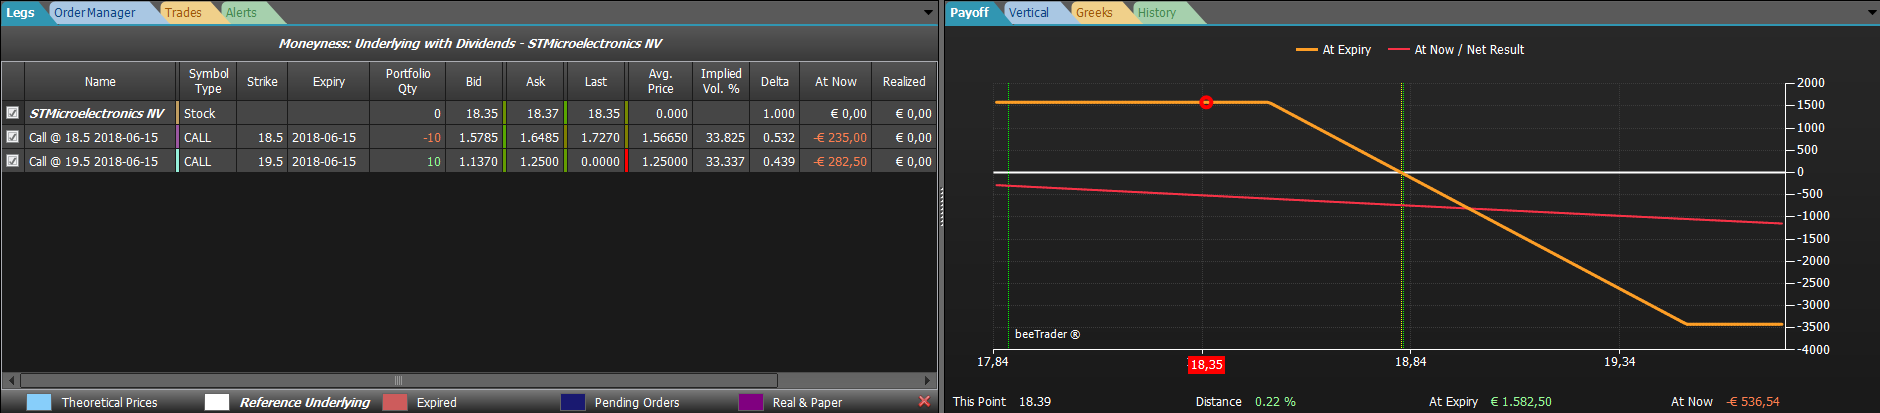
The section “Legs Payoff” shows the legs in the form of dots that are colored in red or green if they are more than one standard deviation from the mean. This type of display allows with a glance to have the complete vision of the legs of the strategies that make up the user's portfolio.
In the lower part of the chart you can choose according on which parameters you see the legs : P/L at expire, P/L at now, P/L at now %, Bep %.
These choices allow the user to see the portfolio in graphical form according to the most important parameters.
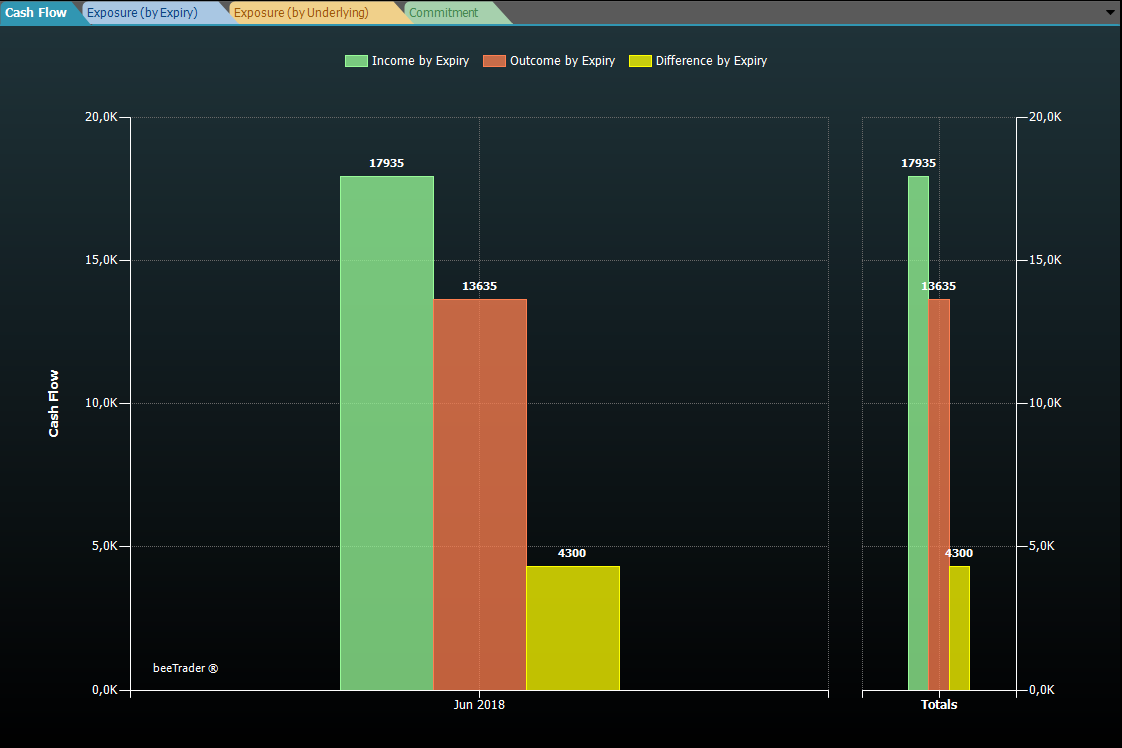
Cash Flow / Risk: It is the section of the portfolio that provides the user the information about the premium at market and the relative risk, the representation takes place through four graphics:

This section provides an overview about the impact of the strategy included in the Portfolio on margins. The section is divided into two graphs: one that displays the the “Margins by Strategy” and one, chosen by the user, can visualize the Value At Risk, the Theoretical Margins or the Broker Margins.
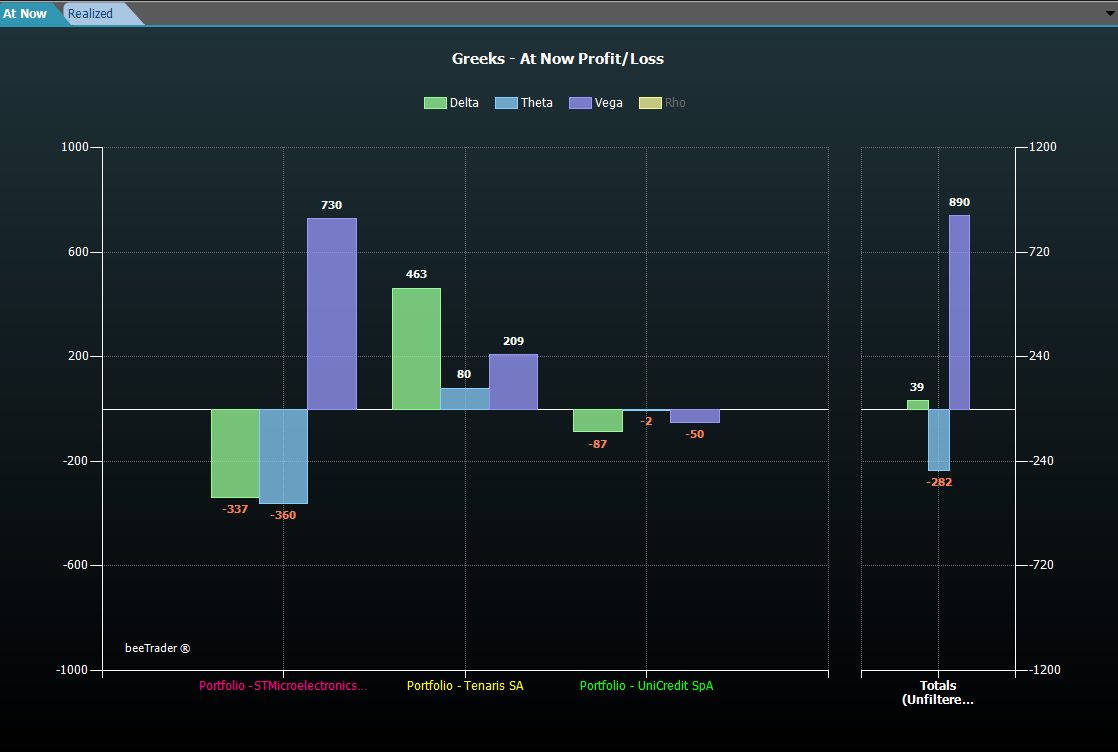
This section is dedicated to the Greeks. This section is composed by two charts:
To the left of the charts is always available a list of the strategies contained in the portfolio with evidence of their values of at now, consolidated, etc.
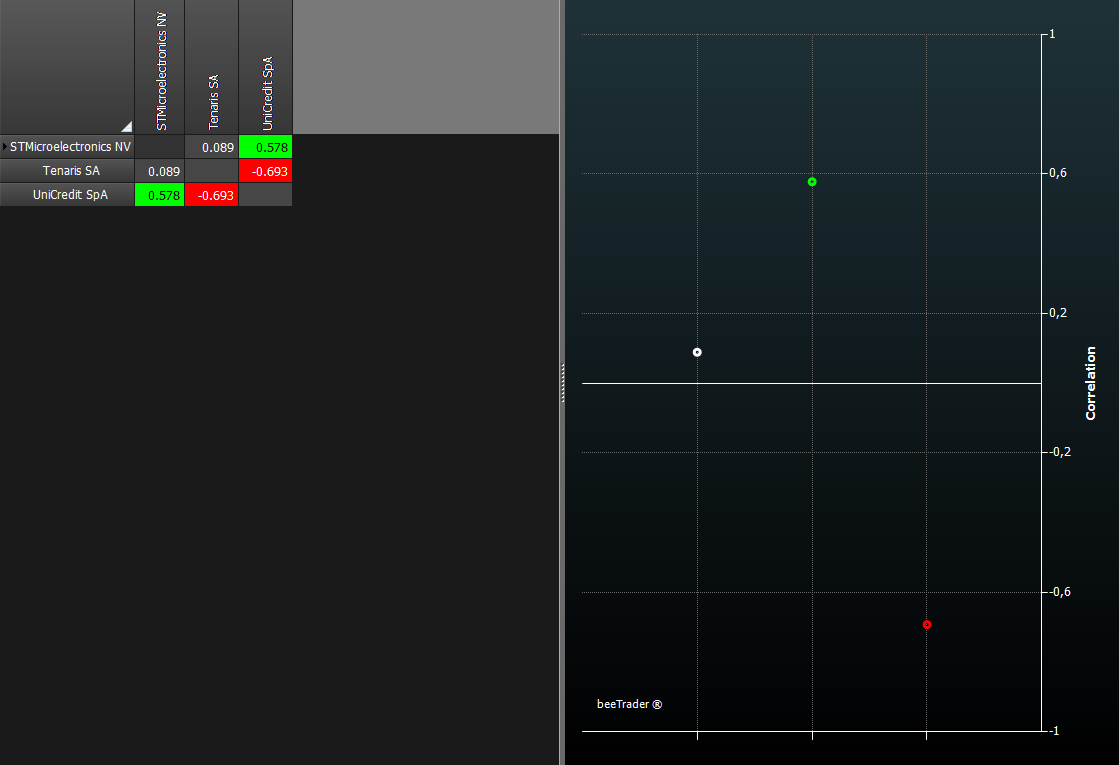
This section shows the correlation matrix between the underlying strategies in the portfolio. The section is composed of a grid where for each pair of securities is shown the correlation in numeric format. There is also a graph that shows a point for each pair distributed between 1 (maximum correlation) and -1 (maximum inverse correlation).
For more information on linear correlation click here.
The margin is the term that identifies the value of the money that are requested by the broker to ensure the counterpart of each derivative contract.
The value of the requested money is the risk of the transaction and will be adjusted, compensate, varying the same risk.
Sell option contracts require margin, the buy don't, because the maximum risk that the buyer take is the premium spent to buy the option .
The seller has an initial margin which change varying market risk and can be compensate buying a different strike of the same typo of options.
the Broker must have to guarantee all the money that could be used at any time to satisfy all parties. This money i pay in to the Clearing House .
But it happens that the broker increases the margin required by (CC&G) maybe because it has the most customers which is exposed to a part (uptrend-downtrend).
it is evident that the portfolio held by the broker has an overall risk that varies from the sum of the positions therefore the margin required for each client will be, for the same operation, different from Broker and Broker, from one day to another one.
Iceberg calculates the margin of transactions considering every Strategy and thus may significantly deviate from the Broker margin on which the strategies were built

The margin is shown as the following picture where you see three histograms:
Those coincide at the begin.
Example: when the strategy is at market you can verify the deviation occurs, we suppose 350%, now you know that the difference between broker margin and theoretical margin is 350% So it is adjusted and that remains for the life of the strategy. We used the Margine Naked ss the margin with defined risk strategies coincides with the maximum risk and does not need to be calculated, so you can, in spread case, If you first close the purchased part which will be the required margin.

By now, the margins are aligned and should remain so for the whole duration of the strategy. In case they will change will it will be sufficient to repeat the operation by entering the new amount.

Their use It does not replace the values required by the Broker, but they reflect the true value that you should have.

In the pie chart you can see that the Value at Risk (remember that being the standard measure for assessing the risk of an investment) is greater on Unicredit, while the margin required by the broker is greater for Eni, this is a sign about how the exposure of the broker towards the Clearing House is greater for Eni
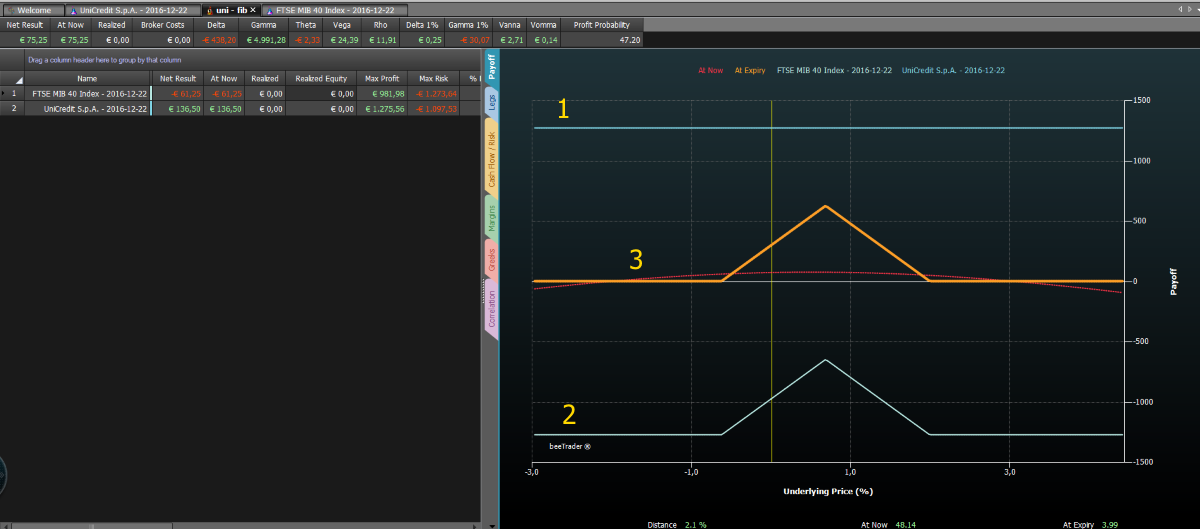
The display of the payoff of portfolio with calendar strategies is on the last date those in the strategy.
As you can see from the image below there are two strategies calendar included in a portfolio with its payoff: payoff 1 (It is flat because the strategy includes the same strike of different expiries)
and payoff 2.
The payoff 3 represents the sum of the payoffs of the strategies including in the portfolio at the farther expiry accounting the result of the closed leg to the short maturity.
 |  |  |

 Mostra, modifica libro (
 Aiuto
Aiuto