

How to use the Manual
Quick Guide
Video Tutorial
Iceberg Features
In-depth analysis
Brokers
Data Feed
Other Manuals of beeTrader Trading Platform
How to use the Manual
Quick Guide
Video Tutorial
Iceberg Features
In-depth analysis
Brokers
Data Feed
Other Manuals of beeTrader Trading Platform
 Aggiungi questa pagina al tuo libro
  Rimuovi questa pagina dal tuo libro
 Questa è una vecchia versione del documento!
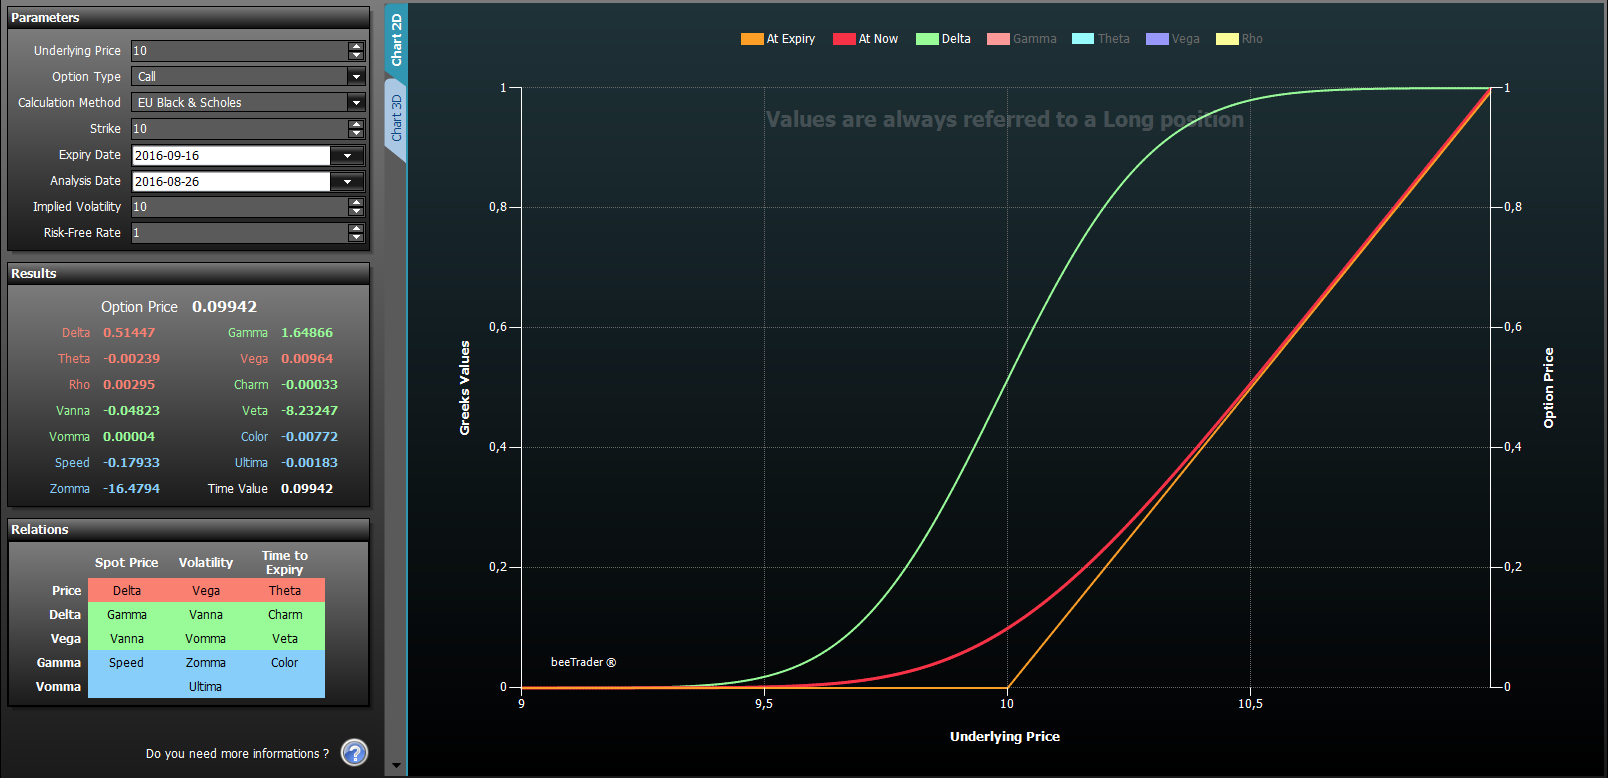
Options Evaluator is a tool that allows to plot the Greek of an option based on user-set parameters. The graphical representation can be in 2D or 3D.
Options Evaluator allows to analyze every single option at a time. In Iceberg there is a more sophisticated function: The Analysis which show the strategy with all its legs.
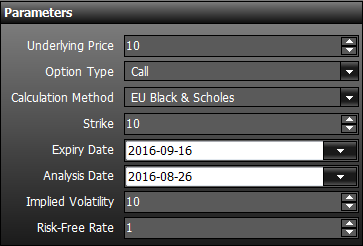 Here the parameters to insert:
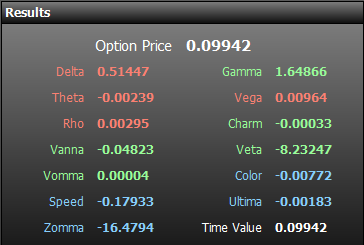
The section “Results” shows the value of each greek. The greeks are divided by color according to their order of derivation. first derivative (yellow), second derivate (green) and third (light blue).
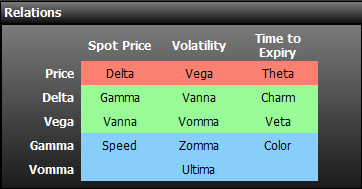
The Greek are linked together according to the relationships expressed in the table Relations.
Example: the Speed measures the rate of change in Gamma with respect to changes in the underlying price.
The greeks are divided by color according to their order of derivation. first derivative (yellow), second derivate (green) e terza (light blue).
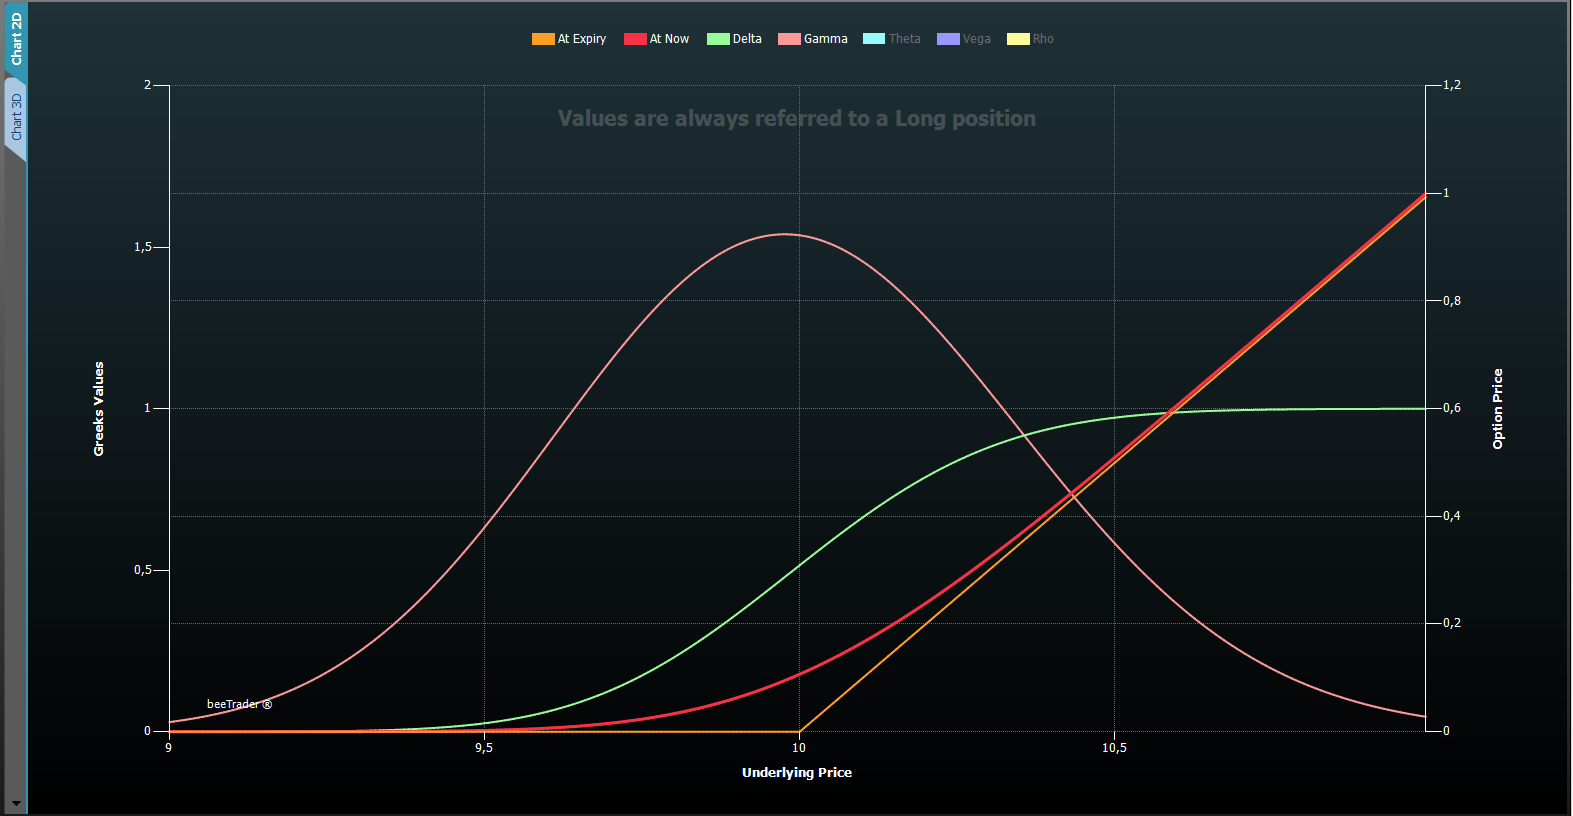
On the left of Y-Axis we have the value of the greeks while on the right one we have the price of the option. For the X-Axis the user can choose the property to display by using the menù.
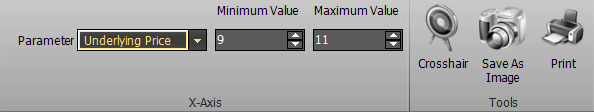
| Parameter | it allows to select the properties to display on the X axis, between Underlying Price, Time to Expiry, Volatility, Risk-Free Rate |
| Minimum Value | It allows to choose the minimum value of the X axis, depending on the chosen property |
| Maximum Value | It allows to choose the maximum value of the X axis, depending on the chosen property |
 | It enable or disable the Crosshair for 2D graphics | |
 | It allows to save the current 2D graph in image format (*.png). The image will be saved in the Pictures folder of beeTrader, in the user's Documents | |
 | It allows to print the 2D graph currently in use. Feature available on the PC in use if there is a printer | |
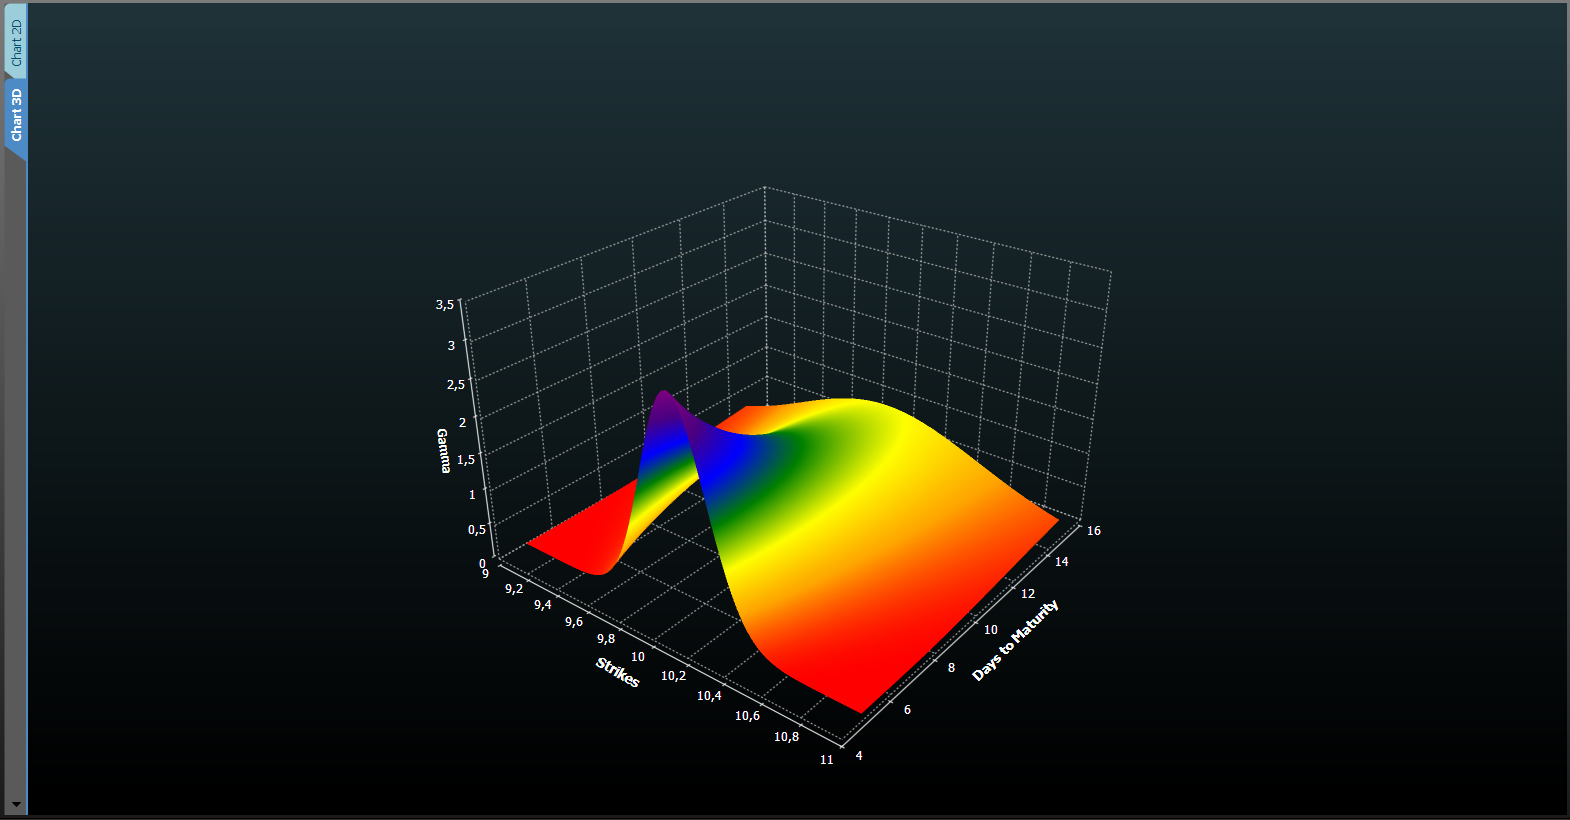
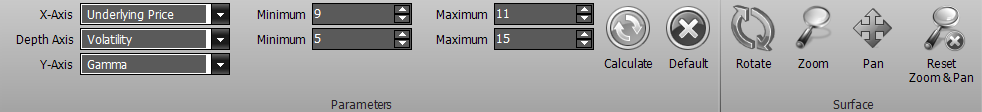
| X-Axis | it allows to select the properties to display on the X axis, between Underlying Price, Time to Expiry, Volatility, Risk-Free Rate | |
| Depth Axis | it allows to choose the properties to display on the Depth axis, between Underlying Price, Time to Expiry, Volatility, Risk-Free Rate | |
| Y-Axis | it allows to choose the Greeks or the Options price to display on the Y axis. Greeks: Delta, Gamma, Theta, Vega, Rho, Vanna, Charm, Speed, Zomma, Color, Veta, Vomma, Ultima, Time Value | |
| Minimum | It allows to choose the minimum value of the X axis or depth, depending on the chosen property | |
| Maximum | It allows to choose the maximum value of the X axis or depth, depending on the chosen property | |
 | It allows to make a new calculation and then a new drawing if the parameters have been changed | |
 | It allows to load the configuration of the default parameters | |
 | once activated by pressing and holding the left mouse button you can rotate the surface by moving the mouse | |
 | once activated by pressing and holding the left mouse button you can zoom into the surface by moving the mouse | |
 | once activated by pressing and holding the left mouse button you can move the surface by moving the mouse | |
 | It reset all the graphical changes and return to the initial view | |
Here the user can read a little extract from a thread of Playoptions forum in order to have an idea of the utility of higher order greeks.

Vanna is the sensitivity of the option delta with respect to change in volatility; or alternatively, the partial of vega with respect to the underlying instrument's price.
It has a positive value for Call options and a negative one for the Put. By increasing the implied volatility, the chance for the options to go ITM increase. This is like to have an higher Delta (in absolute value).
A Trader would think to hedge a strategy just looking at the delta: if the volatility increases, the delta increases and thus increases the amount of the underlying to use to neutralize the event.
But if he watch the Vanna what would change?
Suppose you have a type Reversal Strategy, long Call e Short Put and suppose that happen two simultaneous events: the price falls and the volatility increases.
This case would cause more damage on Put side beacause you will have an increase of the implied volatility and thus the delta.
In practice the position Vanna positive is becoming more exposed in a market which is falling.
So the bearish risk grow due to the implied volatility and spot price.
This shows that in cases of multiple events the greater the risk is measured by the greek Vanna.

Gamma measures the rate of change in the delta with respect to changes in the underlying price while Vomma measures the rate of change to vega as volatility changes.
It is very important for Calendar or other volatility strategy.
When the trader watch the vega he knows that when the volatility will vary of 1 point the value of the strategy will change of the amount of Vega.
Approximately!
Because Vega, similar to a snowball rolling on more snow, change its size!! It can become unexpectedly large or small.
So we measure the variation of Vega by watching value of Vomma.
the figure shows that it is practically irrelevant in the ATM options but becomes important in the wing, symmetrically.

The Vomma grows when the volatility falls so if you have a “long Vega” strategy a decrease of volatility will have an higher impact than shown by the Vega!
You can find this values by clicking right in Strategy, in the columns of the individual option values, strategy or portfolio. The analysis with the respective graphs can be found in Option Evaluator or in the window Analysis.

Look here what happens zooming-in the image above of real strategy:
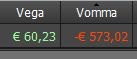
The strategy is Vega positive!
But it isn't true! It is negative by 10 times.

And it is also visible in the chart of At-now.

 Mostra, modifica libro (
 Aiuto
Aiuto