

How to use the Manual
Quick Guide
Video Tutorial
Iceberg Features
In-depth analysis
Brokers
Data Feed
Other Manuals of beeTrader Trading Platform
How to use the Manual
Quick Guide
Video Tutorial
Iceberg Features
In-depth analysis
Brokers
Data Feed
Other Manuals of beeTrader Trading Platform
 Aggiungi questa pagina al tuo libro
  Rimuovi questa pagina dal tuo libro
 Questa è una vecchia versione del documento!
This function allows to estimate some value of interesting throught the Metodo Montecarlo. The window is composed by two sections. One with the Simulation Parameters and the other with their graphs.

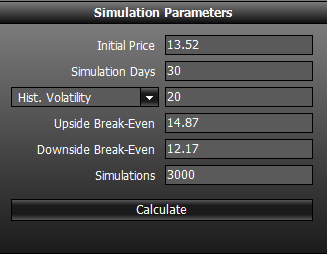 Below there are the parameters to insert for starting the simulation:
If the Monte Carlo simulation is initiated by the strategy, fields are automatically compiled with the values of the strategy, which available.
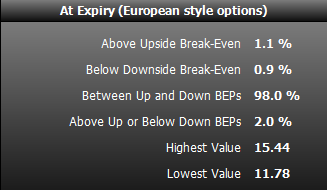 At Expiry (European style options)
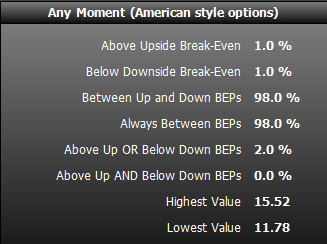 Any Moment (American style options)

In this chart are represented the launches of Monte Carlo simulation, at every launch corresponds to a point. It is then displayed the simulation expiration price.
This chart generates the percentages shown in the box “At Expiry”.

In this chart is indicated viene indicato the maximum and the minimum for each day of the simulation, not only for the expiry. This is for options with American style (like stocks).
This chart generates the percentages shown in the box “Any Moment”.

The table shows the prices generated by the launches set for each day of the simulation.

 Mostra, modifica libro (
 Aiuto
Aiuto 
