

How to use the Manual
Quick Guide
Video Tutorial
Iceberg Features
In-depth analysis
Brokers
Data Feed
Other Manuals of beeTrader Trading Platform
How to use the Manual
Quick Guide
Video Tutorial
Iceberg Features
In-depth analysis
Brokers
Data Feed
Other Manuals of beeTrader Trading Platform
 Aggiungi questa pagina al tuo libro
  Rimuovi questa pagina dal tuo libro
 Questa è una vecchia versione del documento!
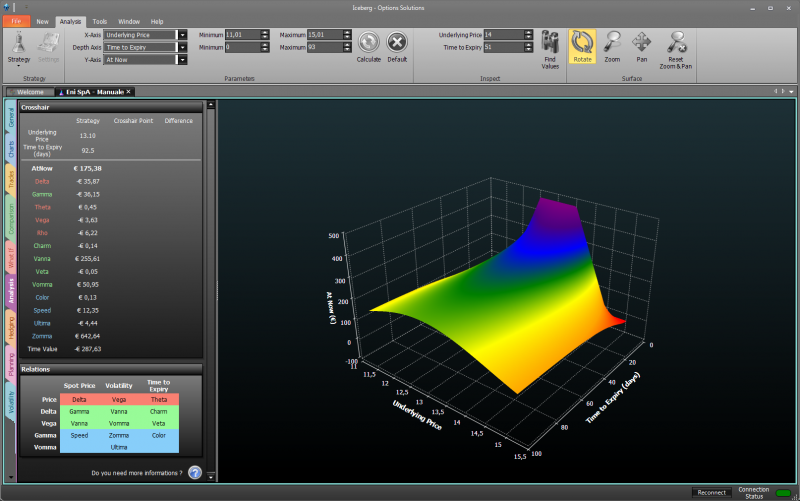
In this section it is possible to analyze the strategy through a graph 3D fully customizable. The graph shows the evolution of the same in function of the parameters set by the user. The user may choose to display the property in order to obtain the graphical representation that he like and at any point he can assess the value of the Greek and at-now strategy.
The Analysis function is an advanced version of Options Evaluator because it give a wide vision of the strategy with all its legs, while with Options Evaluator the user can analyze one option at a time

 | it open the submenu | |
 | it create a new Strategy | |
 | it allows to open a previously saved Strategy | |
 | It allows to save the Strategy currently in use | |
| X-Axis | it allows to select the properties to display on the X axis, between Underlying Price, Time to Expiry, Volatility, Risk-Free Rate |
| Depth Axis | it allows to choose the properties to display on the Depth axis, between Underlying Price, Time to Expiry, Volatility, Risk-Free Rate |
| Y-Axis | it allows to choose the Greeks or the Options price to display on the Y axis. Greeks: Delta, Gamma, Theta, Vega, Rho, Vanna, Charm, Speed, Zomma, Color, Veta, Vomma, Ultima, Time Value |
| Minimum | It allows to choose the minimum value of the X axis or depth, depending on the chosen property |
| Maximum | It allows to choose the maximum value of the X axis or depth, depending on the chosen property |
 | It makes a new calculation and then a new drawing if the parameters have been changed | |
 | It loads the default parameters | |
 | once activated by pressing and holding the left mouse button you can rotate the surface by moving the mouse | |
 | once activated by pressing and holding the left mouse button you can zoom into the surface by moving the mouse | |
 | once activated by pressing and holding the left mouse button you can move the surface by moving the mouse | |
 | It reset all the graphical changes and return to the initial view | |
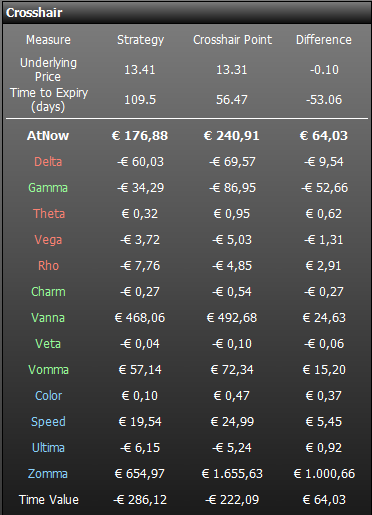
It shows the greeks value and the at-now. The first column indicates the starting values of the strategy. The second column shows the corresponding values to the point where the mouse pointer. The third column shows the difference between the previous.
The greeks are divided by color according to their order of derivation. first derivative (yellow), second derivate (green) e terza (light blue).
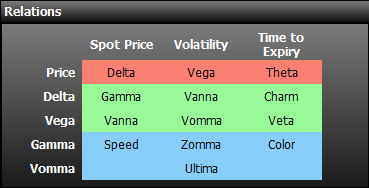
The Greek are linked together according to the relationships expressed in the table Relations.
Example: the Speed measures the rate of change in Gamma with respect to changes in the underlying price.
The greeks are divided by color according to their order of derivation. first derivative (yellow), second derivate (green) e terza (light blue).

 Mostra, modifica libro (
 Aiuto
Aiuto