Questa è una vecchia versione del documento!
Introduction to the Fiuto's world
In order to exploit all tool potentialities of this new, it needs to fully understand the project based on which it has been built.
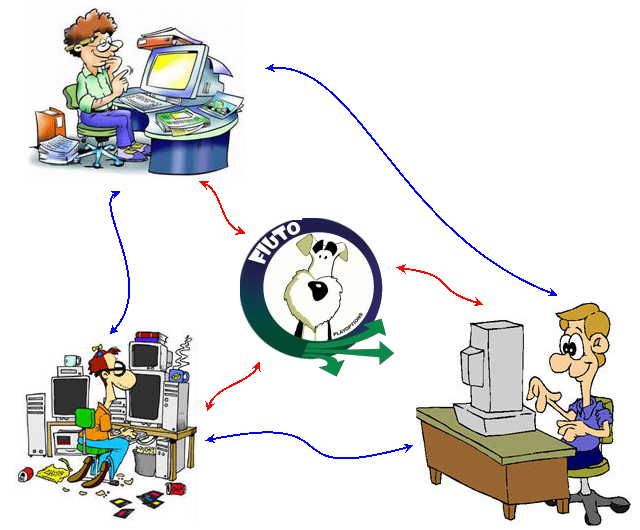
The trader undertaking the road of the investments in options, needs a continuous support, the possibility to compare itself with other traders, to receive concrete and immediate answers to the difficulties that faces.
- Fiuto Beta it is the software projected and developed from sector experts in order to support with the right answers these necessities.
- Fiuto is interactive, born for allowing any community’s trader to share its own strategies or to send it to the Playoptions’ expert systems to get an immediate evaluation of the strategy.
- For the Teachers teachers who will apply will be freely provided with, an exclusive network. In this environment the strategies that the teachers’ staff, or the group of their clients will make available, can be exchanged, divulged, studied, introduced, followed and sold.

This sharing possibility allows to send or receive some strategies that might immediately be visualized and used, or modified and re-sent to other traders for a further study.
What will be got is a strong strategy, a strategy to which so many brains will have given their contribution.
The Fiuto’s network is built for different ability levels.
There is a first level where whoever can enter and send or receive strategies, up to the area devoted to the SuperTraders where the best traders of the world may exchange their jobs. The access permission is earned with the job: the more it is learned, better the gotten evaluations will be.
Higher the scores will be and more difficulty will have the accessible area. Fiuto provides the visualization of the mayor world underlying in order to allow Traders of different nations to work together as a team.
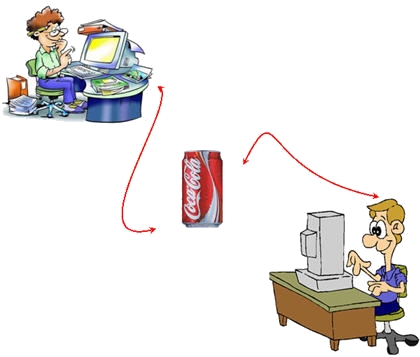
For instance it would be possible to begin with a strategy on Coke and forward it in sharing to all users. A trader in America or in Germany or in Israel might be interested to the same underlying and download the strategy on Coke.

To amend some details and to forward it back in sharing. It is clear that after each amendment the strategy will be improved and, when a discreet evaluation will also be got that might be the moment to decide to activate it taking position on the market with greater probabilities of success.

Features
- For the correct use is necessary to understand the operation of the data stream that feeds the calculations.
* The data referred to are not in real time but in late 20 '.
* The data for the graphs of the underlying and for the calculation of the options are taken from free sources found on the web and are generally lagging behind in 20 '.
* The bars are composed of the chart with this data with the exception of the bar corresponding to the day when we are effettundo analysis that is fed with data or not delayed or delayed for a few minutes (20 'maximum).
* As a general rule you have access to a series sometimes very large, even for some tens of years. Other underlying could however be provided with the most recent stories.
* For options on indices, we consider equal to the reference price index and in the future.
—-
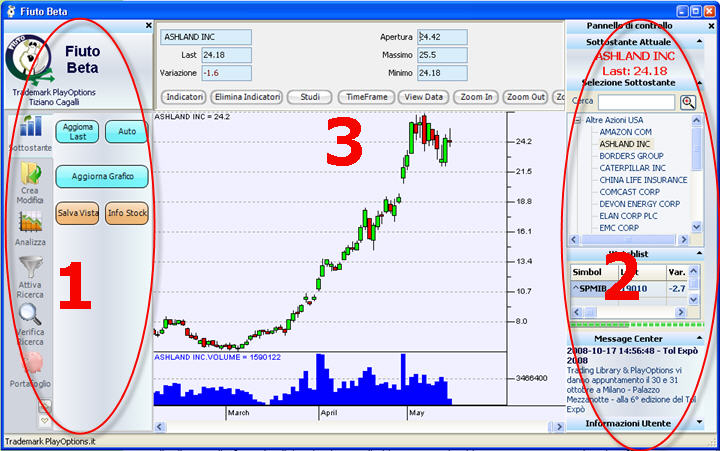
La schermata principale si divide in tre sezioni, quelle laterali saranno sempre presenti mentre si navigherà nella finestra centrale.

La prima parte a sinistra è dedicata alle funzioni di aggiornamento. Partendo dall’alto troviamo i bottoni:
* “aggiorna Last” mediante il quale possiamo fare un refresh dei dati relativi all’ultima barra, senza dover attendere l’eventuale timeout di aggiornamento;
* “auto”, che imposta l’aggiornamento a scadenza prestabilita e sotto il quale compare anche la finestra del conto alla rovescia;
* “aggiorna Grafico che ci consente di aggiornare tutti i dati del grafico con le eventuali barre mancanti come illustrato in precedenza;
* “salva Vista, che ci consente di salvare l'immagine del grafico in una apposita cartella;
* “Info Stock, che apre una pagina Internet dove si troveranno le informazioni finanziarie riferite al sottostante che stiamo studiando;
—- La seconda parte, quella di destra, è relativa al pannello di controllo e si compone di diverse partizioni. Questa parte è comune a tutte le schermate e ci consente di navigare da un sottostante all’altro indipendentemente da quali siano le funzioni operative in quel momento. In alto, dopo le informazioni sull’utente abilitato per la piattaforma, possiamo leggere le informazioni sul sottostante in quel momento in esame e la quotazione registrata con l’ultimo aggiornamento. La selezione del sottostante può avvenire in 2 modi: * utilizzando il campo “cerca”. Sarà sufficiente digitare le prime lettere che compongono il nome del sottostante ed il software ci presenterà l’ipotesi selezionata. Continuando ad aggiungere lettere renderemo più selettiva la ricerca sino ad incontrare il risultato desiderato; * ricercandolo e scegliendolo dai vari rami con cui i sottostante sono organizzati. Quindi se vogliamo il grafico di Coca Cola possiamo inserire alcune lettere nel campo cerca – è sufficiente “coc” – oppure aprire il ramo “azioni Dow Jones 30” e poi fare click su Coca Cola. Subito sotto la selezione sottostante troviamo una WatchList in cui possiamo digitare i ticker dei sottostanti di nostro interesse per monitorare sinteticamente le loro variazioni.
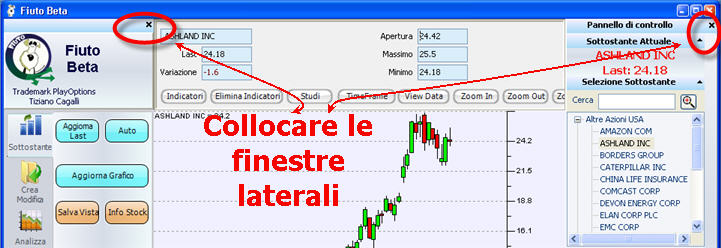
Il successivo Message Center ci consentirà di essere costantemente informati sulle iniziative di PlayOptions. N.B.:Per avere un maggior spazio a disposizione una volta utilizzate, le finestre laterali si possono “collocare” e chiudere facendo click sul pulsante di chiusura. Per riaprirlo temporaneamente ci sarà sufficiente spostare il mouse sul bordo destro della finestra di destra o il bordo sinistro per quelle di sinistra. Per riaprirle definitivamente faremo nuovamente click sul pulsante di chiusura.

—- La terza parte, quella centrale, è riservata al grafico del prezzo e all’istogramma dei volumi del sottostante selezionato. La parte superiore riporta le informazioni ricavate dall’ultimo aggiornamento e subito sotto altri bottoni ci consentono di accedere a funzioni ed informazioni specifiche: da un largo numero di indicatori ed oscillatori, ai vari studi grafici applicabili, sino alla modifica della visualizzazione dei dati.
—-


Discussione