Indice
Open Interest Cross
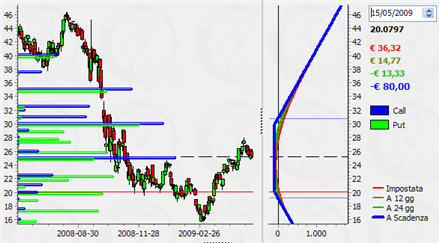
After having updated the Open Interest data with the special key and with the procedure already described, we are able to plot the histogram bars on the underlying’s graph, exactly in correspondence of the various prices. It is another way to insert the available information to the purpose of a good reading of what the market is doing and to widen therefore the horizon of our knowledge.
