Sight Probability
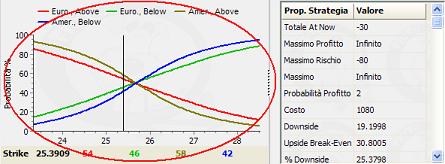
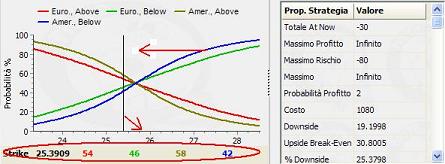
The graph of the probabilities that on expiration the underlying have reached a specific value it is illustrated in the central lower part of the screen. The ” Sight Probability” is prompted by default on the opening of the function “Analyse”.

Here we can study the curves of the statistic percentages probabilities to report to the possibility that the underlying, on expiration, be positioned above or under to the strike value. There are represented both the probabilities of European style options (exercisable only on expiration) and of those American style (exercisable in any moment up to expiration). To read such values it is enough to drag the mouse pointer and to read the values in the display at the bottom of the graph.
