Indice
Montecarlo Simulation
This function allows to estimate some value of interesting throught the Metodo Montecarlo. The window is composed by two sections. One with the Simulation Parameters and the other with their graphs.

Video Tutorial


Simulation Parameters
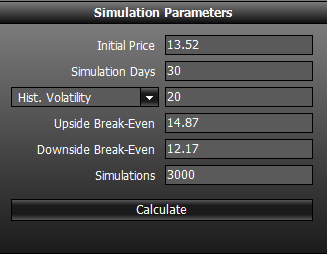 Below there are the parameters to insert for starting the simulation:
- Initial Price: starting price from which the launch will be made;
- Simulation Days: number of days of the simulation;
- Standard Deviations: value of 1 standard deviation relative to the performance of the underlying price calculated over 21 days;
- Upside Break-Even: upper limit with its probability percentage;
- Downside Break-Even: lower limit with its probability percentage ;
- Simulations: number of launches that will be executed. Please remember that 25,000 deployments are a minimum number in order to obtain statistically significant results.
If the Monte Carlo simulation is initiated by the strategy, fields are automatically compiled with the values of the strategy, which available.
Results
 At Expiry (European style options)
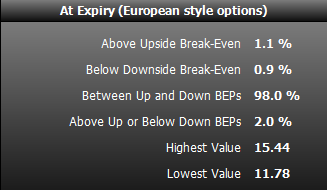
- Above Upside Break-Even: it indicates the percentage of probability that at expiry the price of the underlying is higher of Upside Break-Even Point;
- Below Downside Break-Even: it indicates the percentage of probability that at expiry the price of the underlying is lower of Downside Break-Even Point;
- Between Up and Down BEPs: it indicates the percentage of probability that at expiry the price of the underlying is between the Break-Even Points;
- Above Up or Below Down BEPs: it indicates the percentage of probability that at expiry the price of the underlying is out of Break-Even Points;
- Highest Value: it indicates the highest value obtains by simulation;
- Lowest Value: it indicates the lowest value obtains by simulation.
 Any Moment (American style options)
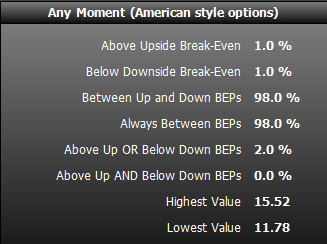
- Above Upside Break-Even: It indicates the percentage of probability that the price of the underlying is higher of Upside Break-Even Point in the time frame set in the Simulation Days;
- Below Downside Break-Even: It indicates the percentage of probability that the price of the underlying is lower of Downside Break-Even Point in the time frame set in the Simulation Days;
- Between Up and Down BEPs: It indicates the percentage of probability that the price of the underlying is between the Break-Even Points in the time frame set in the Simulation Days;
- Always Between BEPs: indica It indicates the percentage of probability that the price of the underlying is always between the Break-Even Points in the time frame set in the Simulation Days;
- Above Up OR Below Down BEPs: It indicates the percentage probability that the price of the underlying has been at least one time highter of Upside Break-Even Point OR lower of Downside Break-Even Point in the time frame set in the Simulation Day;
- Above Up AND Below Down BEPs: It indicates the percentage probability that the price of the underlying has been at least one time highter of Upside Break-Even Point AND lower of Downside Break-Even Point in the time frame set in the Simulation Day;
- Highest Value: it indicates the highest value obtains by simulation;
- Lowest Value: it indicates the lowest value obtains by simulation.
Chart "At Expiry"

In this chart are represented the launches of Monte Carlo simulation, at every launch corresponds to a point. It is then displayed the simulation expiration price.
This chart generates the percentages shown in the box “At Expiry”.
Chart "Any Moment"

In this chart is indicated viene indicato the maximum and the minimum for each day of the simulation, not only for the expiry. This is for options with American style (like stocks).
This chart generates the percentages shown in the box “Any Moment”.
Data Grid

The table shows the prices generated by the launches set for each day of the simulation.