Future Chart
Once a Plan has been created we can test it in order to verify if it perform in different market condition.
In Iceberg there is “Simulation” function which allows to create an artificial graph and project the price of the unnderlying in the future in order to verify how it perform The Options are priced with Market Maker Surfaces.
The menu
 | it allows you to add a graphic segment, the dates and the prices of begin and end of the segment need to be set |
 | it allows you to remove a previously added segment to the graph |
 | it allows to generate a new graph with the same parameters of the segments which compose it |
 | it allows you to choose which expires highlight on the chart of the underlying |
 | it allows you to restore the original zoom of the underlying's graph graph |
 | it saves the graph of the underlying in image format (* .png) |
 | it allows you to print the graph of the underlying. Feature available on the PC with a printer |
| it allows you to restore the original zoom of the payoff |
 | it allows you to enable or disable the crosshair on the payoff |
| it allows you to save the payoff in image format (* .png) |
| it allows you to print the payoff. Feature available on the PC with a printer |
 | it allows you to remove a segment previously added to the graph |
 | it allows you to place the simulation in the previous point of the underlying graph |
 | it allows you to place the simulation in the next point of the underlying graph |
 | it allows to activate scrolling point by point of the underlying's graph |
 | it allows to deactivate scrolling point by point of the underlying's graph |
 | it allows to open the page of the manual with the default browser |
Chart Builder
 In this section the user can set different segment which will compose the underlying graph. For every segment is possbible to set the initial and final date and price .
As you create the segments, the graph is make randomly, assuming the trend of underlying between the dates with the user-set prices.
The Fields Start Date, End Date, Start Price e End Price are editable, other fields are calculated and they estimate the deviation of setted price.
Plan Preview
 In the section “Plan preview” the user could verify in every points of the underlying graph whether conditions occurred.
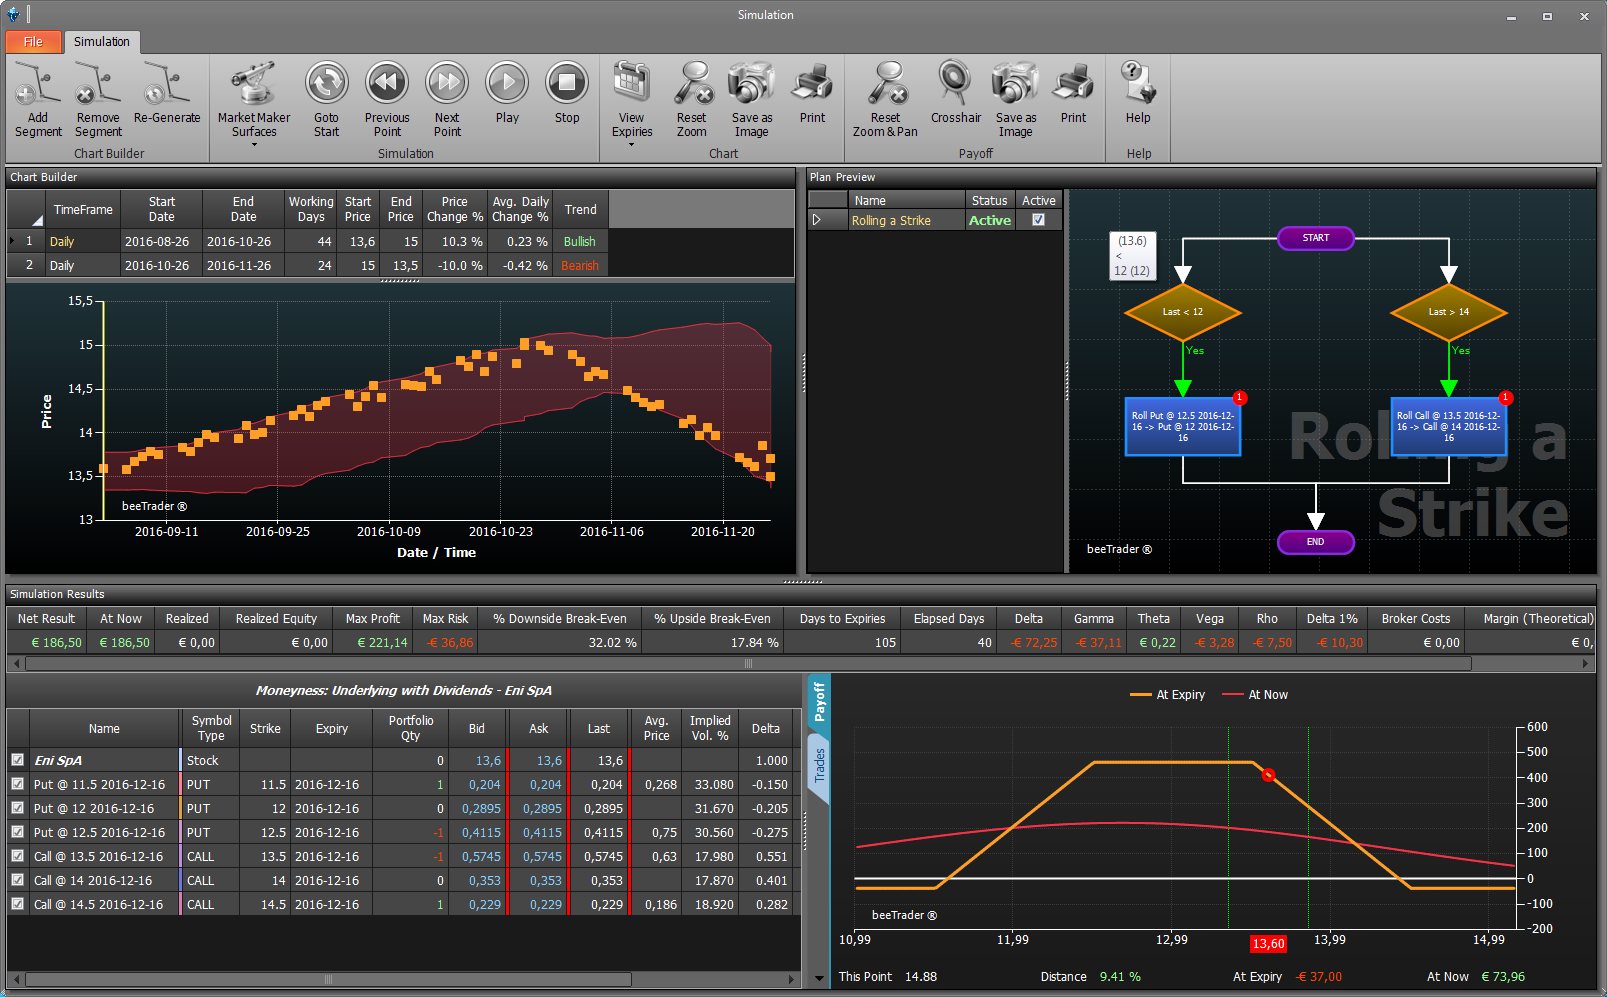
Simulation Results
In this section the user could verify for every point of the graph the parameters of his strategy and the workflow interventions.

You can see the difference between the two images which represents the strategy before and after the simulation. At first the strategy was composed by 5 sell put at strike 10 with the underlying at 12,8. When the simulation start the price goes to 9,84 and, as set in the plan, put 10 were bought and put 9 sold, keeping the initial premium. The payoff has been maintained.
